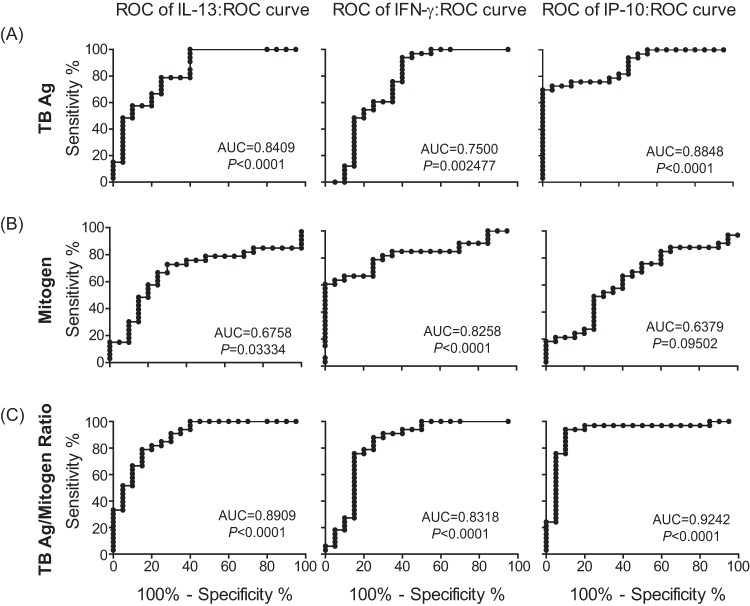
FIG 3.
ROC curves for TB-specific and mitogen-induced cytokine responses. The AUCs of TB-specific (A) and mitogen-induced (B) IL-13, IFN-γ, and IP-10 levels and the ratios of TB-specific to mitogen-induced responses (C) were compared between active TB patients and LTBI. The AUCs and the P values are indicated on the graphs.

