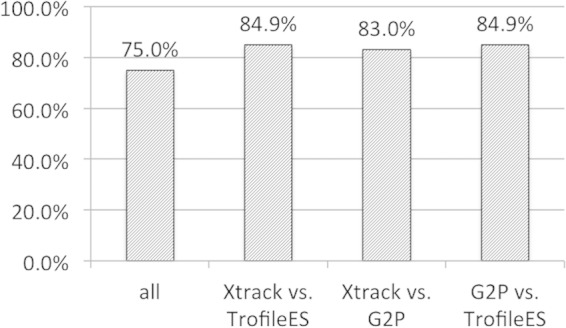
FIG 4.

Degree of agreement between the three systems, based on the data in Table 5. Bars indicate either the overall agreement between the three systems (“all”) or between XTrack and TrofileES, or XTrack and Geno2Pheno, or Geno2Pheno and TrofileES, as indicated. Percent agreement is given above each bar.
