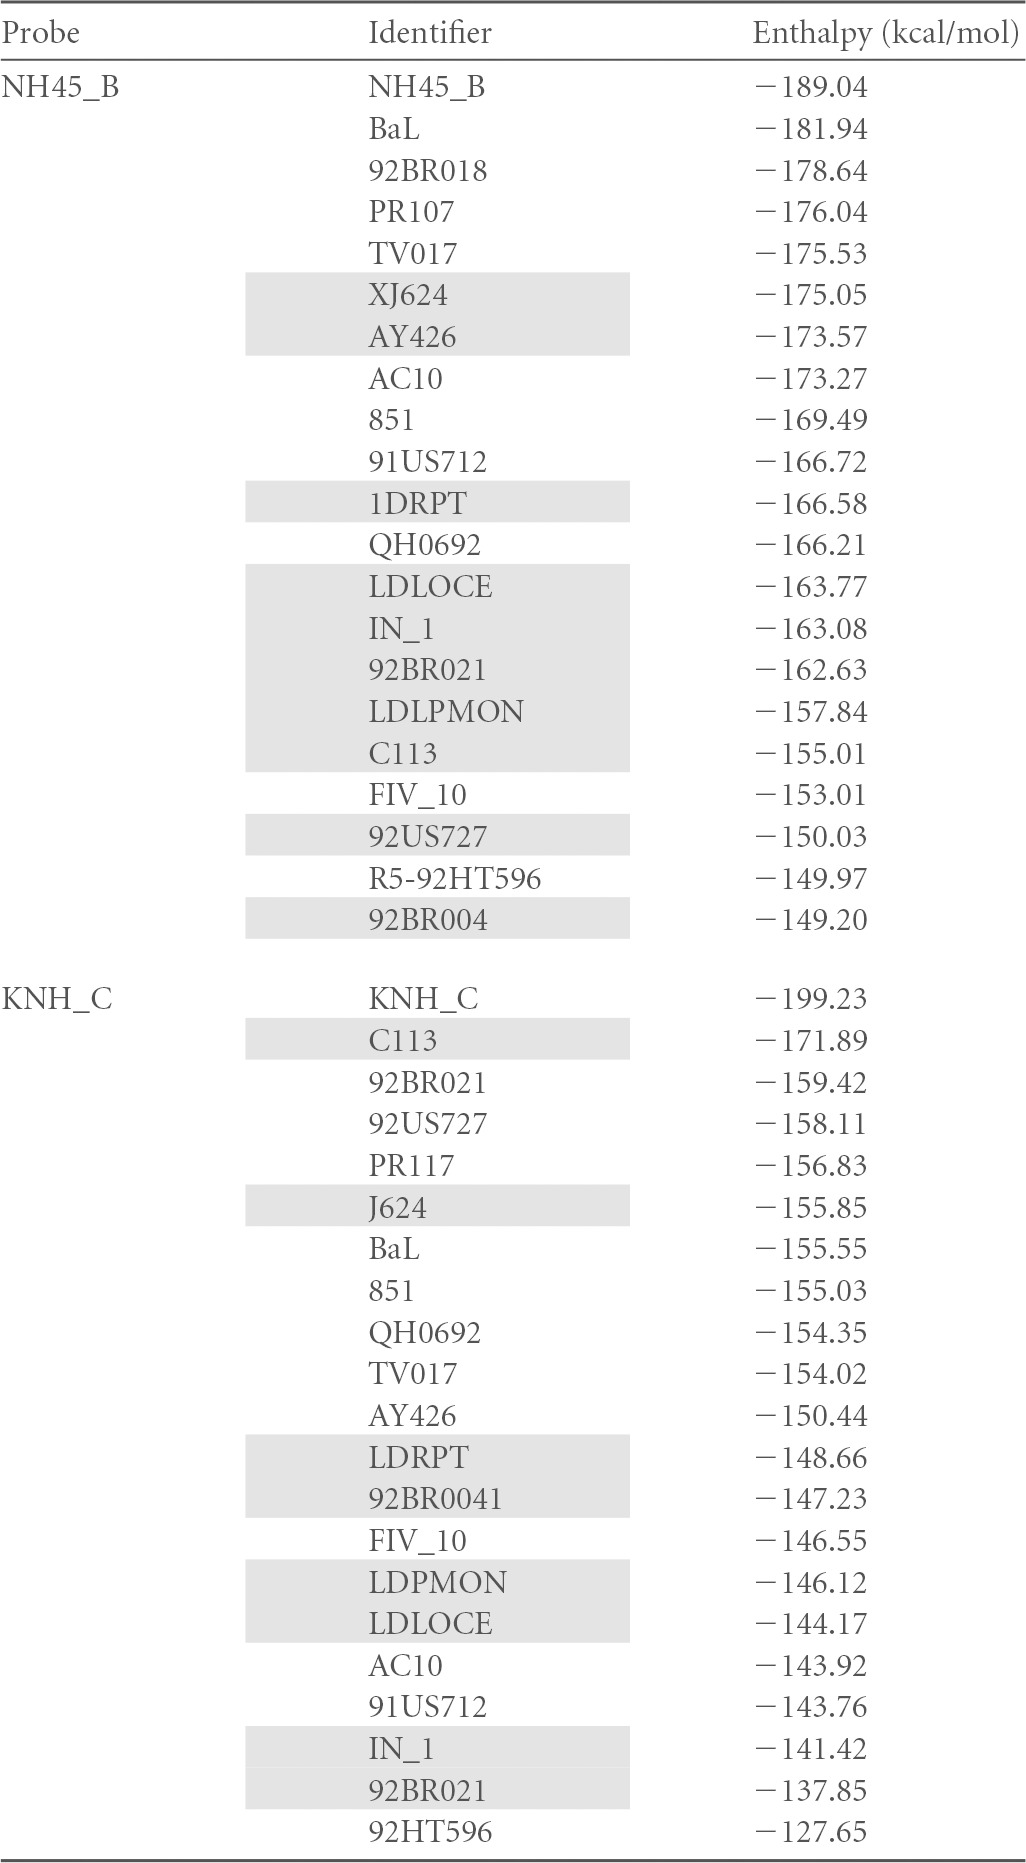
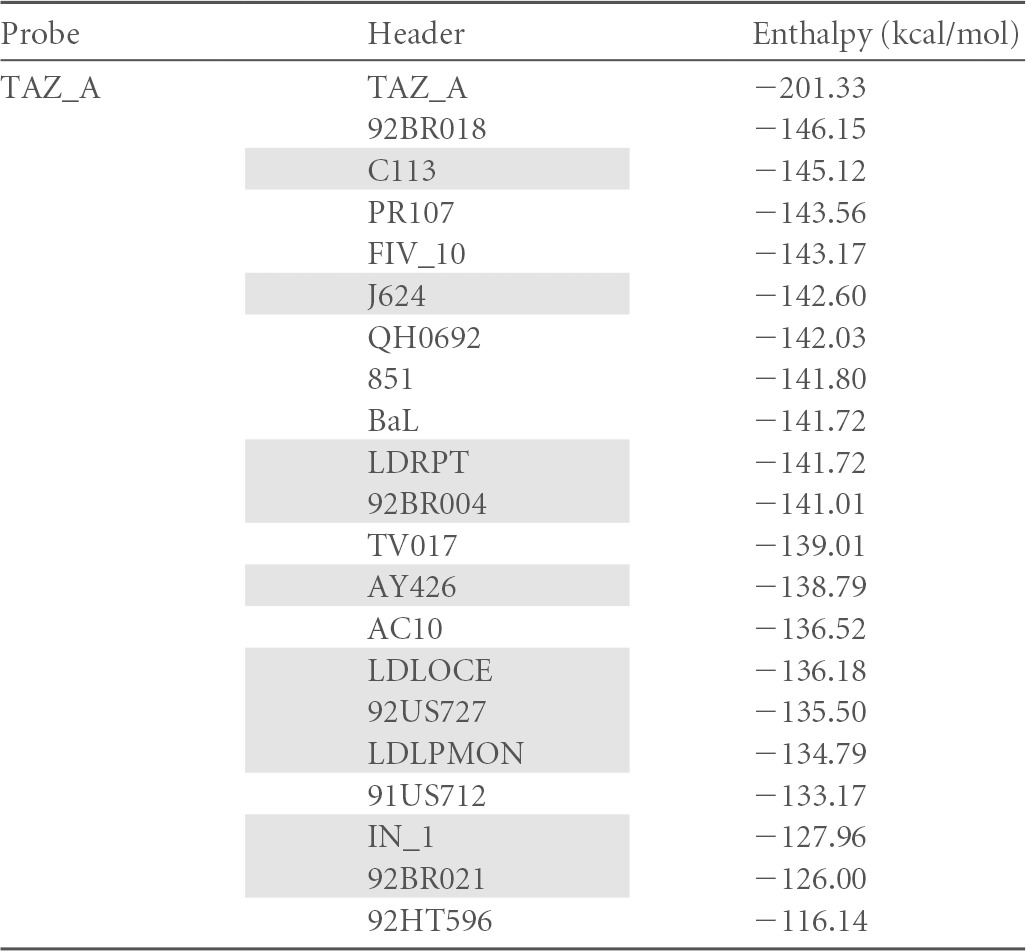
TABLE 1.
Binding enthalpies of three R5-specific probes to a selection of R5 or X4 sequencesa


Unshaded, R5 sequences; shaded, X4 sequences. The top value for each probe corresponds to the perfect match of the probe. Values are sorted by decreasing ΔH values.
