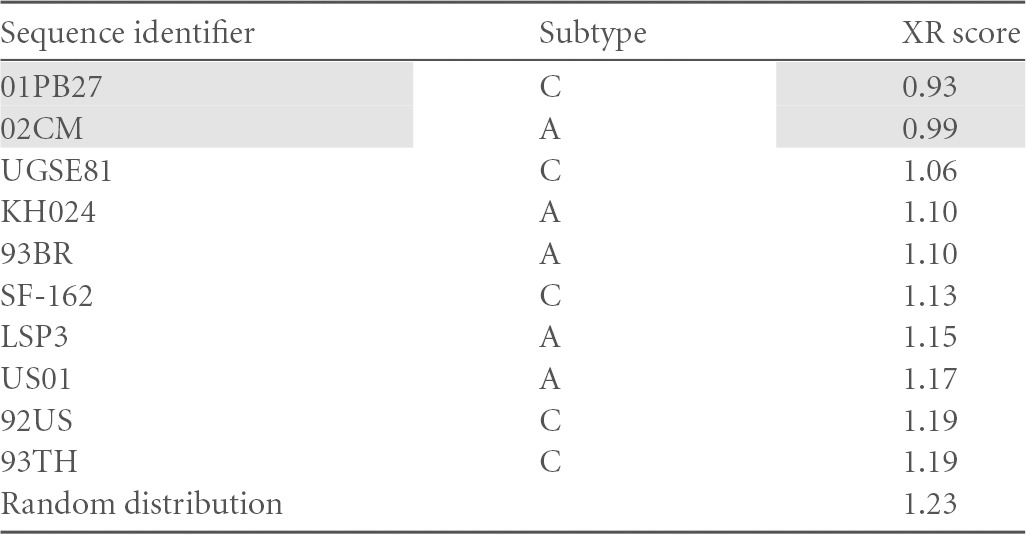
TABLE 3.
XR scores of relatednessa

Calculated for the top 10 R5 sequences of HIV-1 subtypes A or C. Random distribution, reference score for a random distribution of R5 and X4 sequences. Shading indicates the top scoring two sequences, which were used for further experiments.
