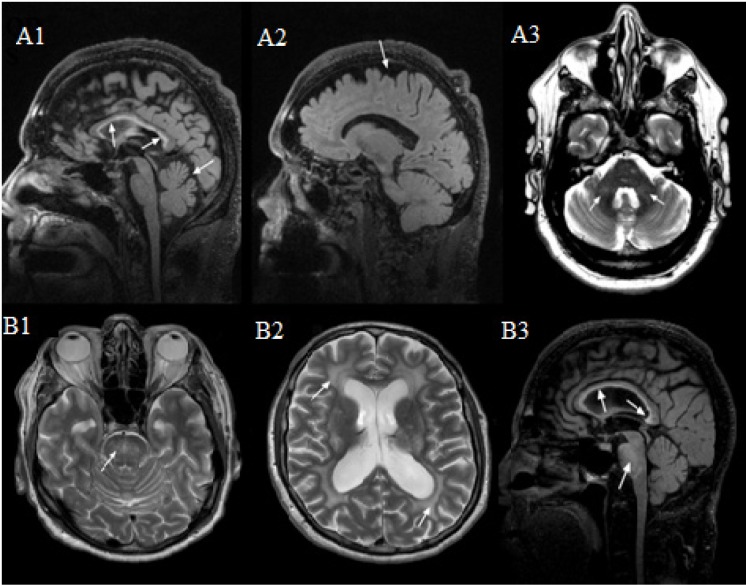
Figure 1.
MRI features of FXTAS. (A1) Moderately thin truncus of the corpus callosum with severe increased signal intensity in both the truncus and the splenium, and moderate cerebellar and cerebral (A2) volume loss. (A3) Mild white matter changes in the middle cerebellar peduncles (MCPs). (B1) Severe increased T2 signal intensity in the pons (can also be seen in B3). (B2) Severe diffuse increased T2 signal intensity in the deep white matter of the cerebrum, as well as periventricular. (B3) Moderately thin truncus of the corpus callosum with severe increased T2 signal intensity in both the truncus and the splenium.

