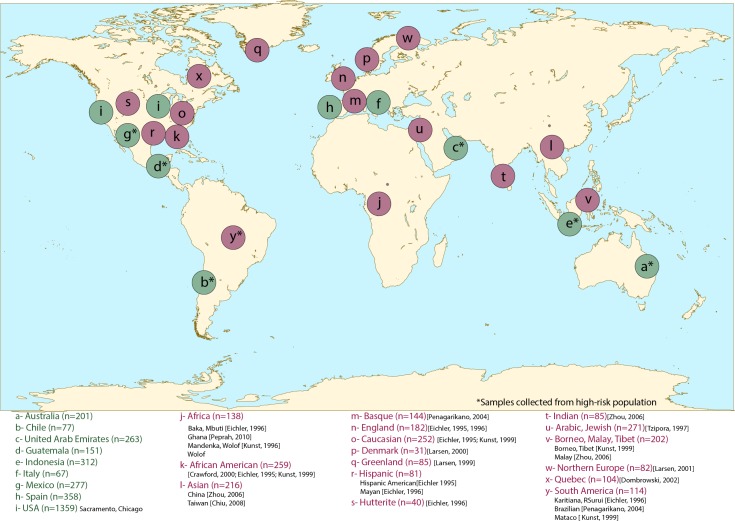
Figure 1.
The distribution of 25 global populations with AGG interruption patterns described. AGG interruption patterns were compared between the 9 newly characterized cohorts (a-i, in green) and with previously published studies (j-y, in red). Populations from previous studies were combined if geographical proximity was present to increase sample sizes. Cohorts with samples collected from high-risk populations are denoted with an asterisk, total sample size for each cohort and the studies reporting their AGG patterns are provided next to the cohort's name.

