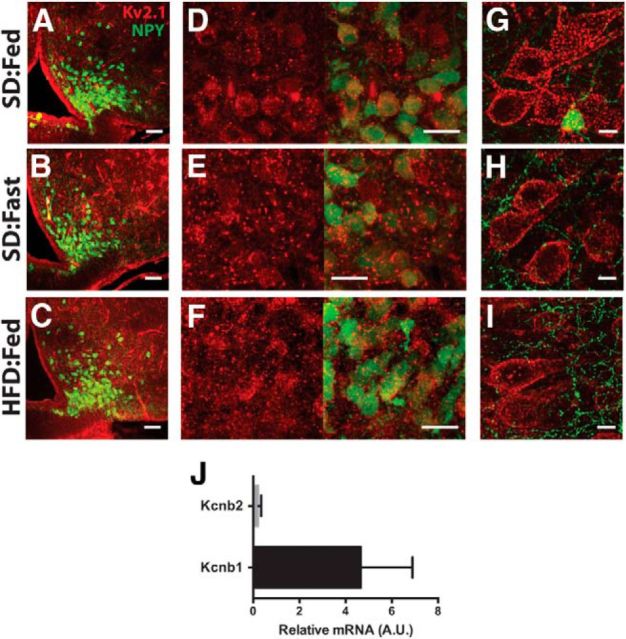
Figure 7.
Kv2.1 immunoreactivity in ARH neurons from hrGFP-NPY mice. A–C, Low-magnification view of Kv2.1 (red) in ARH for anatomical reference. Green indicates GFP expression in NPY neurons. Scale bars, 50 μm. D–F, High-magnification image of Kv2.1 alone (red, left) and Kv2.1 with GFP (right). Scale bars, 20 μm. G–I, High-magnification image of Kv2.1 in cortical layer 2/3 pyramidal neurons. Scale bars, 10 μm. J, Relative transcript levels of Kcnb1 (Kv2.1) and Kcnb2 (Kv2.2) in ARH normalized to S19 expression.

