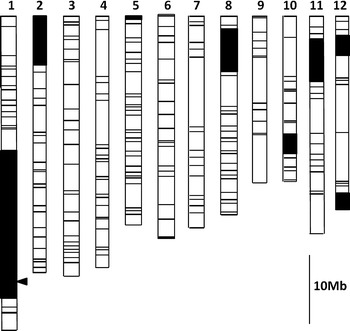
Fig. 1.

Graphical genotype of a resistant BC2F5 line (HK19) used for fine mapping of QTLs. Chromosome numbers are indicated above each linkage map. Positions of marker loci used for genotyping are shown as horizontal lines and were obtained from the linkage map of BILs derived from a cross between Kele and Hitomebore (Mizobuchi et al. 2013a). The arrowhead next to the long arm of chromosome 1 shows the putative position of the QTL for resistance to bacterial grain rot (BGR) (Mizobuchi et al. 2013a) examined in the present study. White boxes indicate regions homozygous for Hitomebore marker alleles; black boxes indicate regions homozygous for Kele marker alleles
