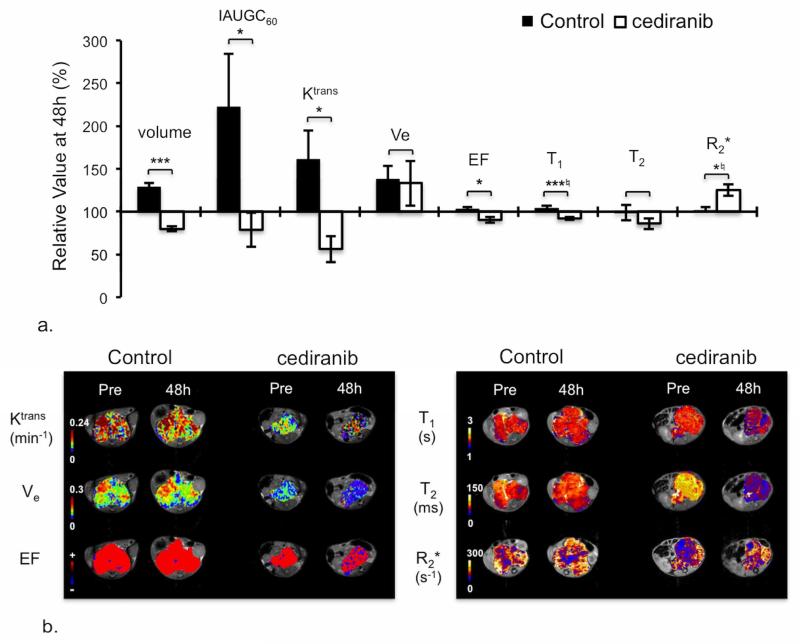
Figure 4.
MRI response of TH-MYCN model of neuroblastoma to cediranib. a) Relative changes in tumor volume and dynamic contrast-enhanced (DCE) MRI-derived parameters: IAUGC60, Ktrans, Ve, enhancing fraction (EF), and native T1, T2 and R2*, over 48h in tumor-bearing TH-MYCN mice, following daily treatment with either vehicle or 6mg/kg cediranib. Normalized data are presented as mean ± 1 standard error of the mean (n=11 for volume, T1, T2, R2*, n=7 for DCE MRI parameters), with any significant differences between control and cediranib-treated cohort indicated (*p<0.05, **p<0.01, ***p<0.005, Student’s 2-tailed unpaired t-test, and *♮p<0.02, **♮p<0.003, ***♮p<0.0002, Student’s 2-tailed unpaired t-test with a Bonferroni correction (n=3)). b) Parametric Ktrans, Ve, EF, native T1, T2 and R2* maps of tumor-bearing TH-MYCN mice acquired prior to and 48h after the beginning of daily treatment with either vehicle or 6mg/kg cediranib.

