Fig. 5.

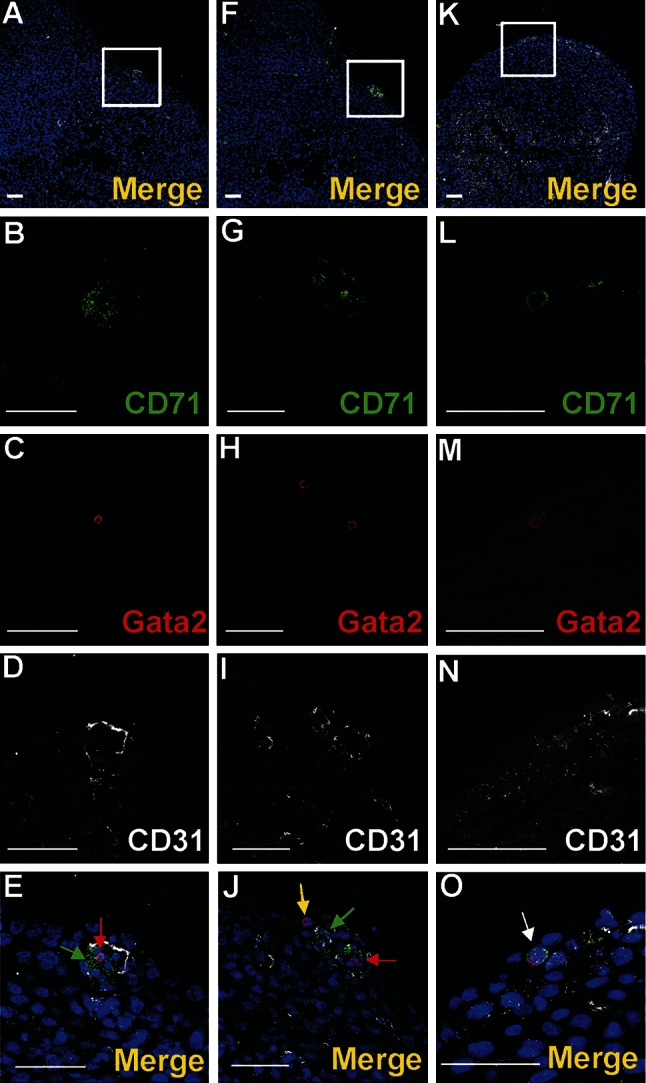
Subepicardial expression of CD71 and Gata2 markers. Confocal microscope images of sections from 13 dpc hearts stained with anti-CD71 (green) (b, g, l), anti-Gata2 (red) (c, h, m), anti-CD31 (white) (d, i, n) antibodies; merged panels showing nuclei counterstained with Hoechst (blue) (a, f, k, e, j, o). The subepicardial areas shown in white boxes of panels a, f, k are enlarged on panels e, j, o. Central part of blood islands consists of various cell populations: CD71+/Gata2− (green arrows) (e, j), CD71−/Gata2+ (red arrows) (e, j) as well as cells negative for both markers. A few CD71−/Gata2+ cells (yellow arrow) are present in the subepicardium, outside of blood islands (j). Double-positive cells (CD71/Gata2) (white arrow in panel o) are located in close proximity to endothelial cells (CD31-positive). Scale bars 50 µm
