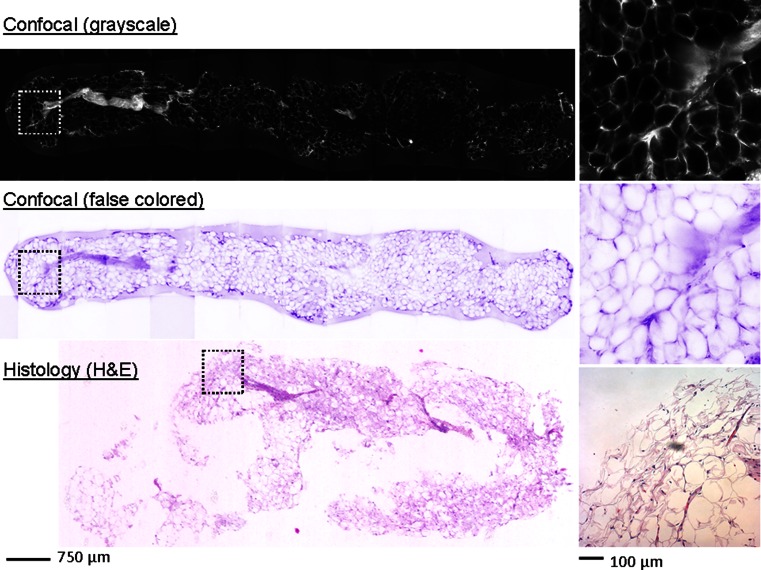
Fig. 3.
Representative core with no invasive tumor (core 22); 0 % cellularity estimated by author S.K. in histologic image (standard H&E staining), 0 % cellularity estimated in grayscale confocal fluorescence image (0.01 % proflavine staining), and 0 % cellularity estimated in false-colored confocal fluorescence image derived from grayscale image (0.01 % proflavine staining). This core is considered inadequate due to sampling error; no invasive tumor is visible despite a clinical indication of IBC. The scale bar at left is 750 μm. The insets at right show a region of non-neoplastic tissue in the CNB specimen. The locations of the insets are indicated in each core by a square with dashed lines. The scale bar at right is 100 μm

