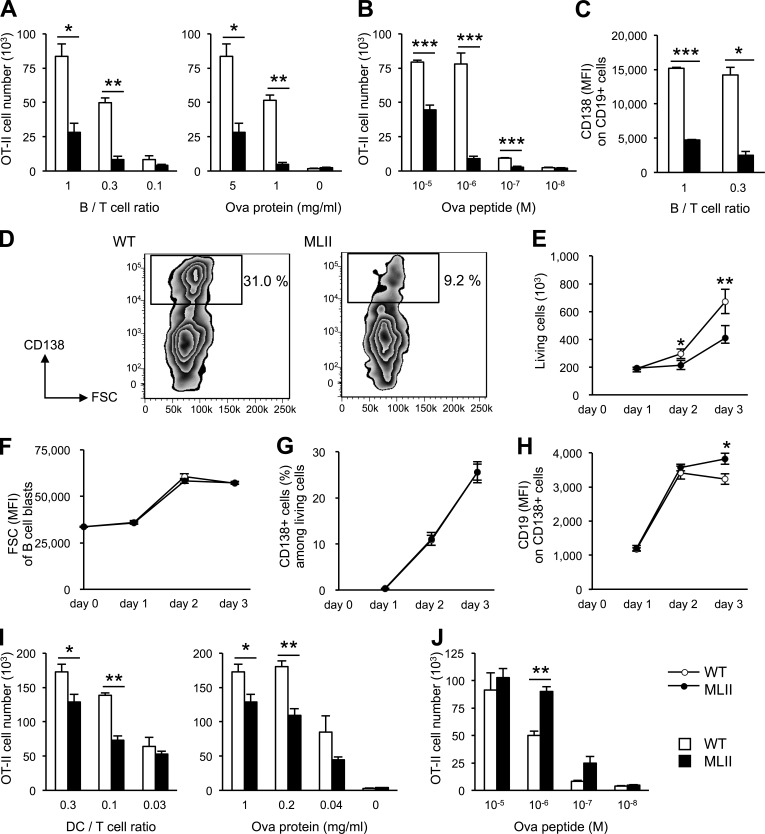
Figure 3.
Defective antigen presentation, proliferation, and differentiation of MLII B cells. (A) Antigen presentation by B cells to Ova-specific CD4 T cells. T cell responses upon loading of B cells with Ova (5 mg/ml) at different B/T cell ratios and loading with different amounts of Ova protein at fixed B/T ratio (1:1) are shown. (B) CD4 T cell response to B cells loaded with Ova peptide at fixed B/T ratio (1:1). (C and D) Impaired differentiation of MLII B cells. (C) Ova antigen presentation test was performed and plasma cell marker CD138 expression on CD19-positive B cells was quantified by flow cytometry. (D) MFI values of CD138 on CD19-positive cells (B/T ratio of 1:0.3) and zebra plots of CD19-positive cells (B/T ratio of 1) are shown. Rectangles indicate region and percentage of differentiated plasmablasts. (E–H) T cell–independent proliferation and differentiation of B cells in vitro. Purified splenic B cells (106) from WT and MLII mice were stimulated with 10 µg/ml LPS and analyzed by flow cytometry at the indicated time. Proliferation of B cells (E), blast formation of B cells determined by forward scatter (FSC; F), percentages of B cells that acquired the plasma cell marker CD138 (G), and MFI of CD19 on CD138-positive cells (H) are shown. (I) T cell responses upon loading of DCs with Ova protein (1 mg/ml) at different DC/T cell ratios and loading with different amounts of Ova protein at fixed DC/T ratio (0.3:1) are shown. (J) CD4 T cell response to DCs loaded with Ova peptide at fixed DC/T ratio (0.3:1). Mean and SEM of three to six experiments. *, P < 0.05; **, P < 0.01; ***, P < 0.001.

