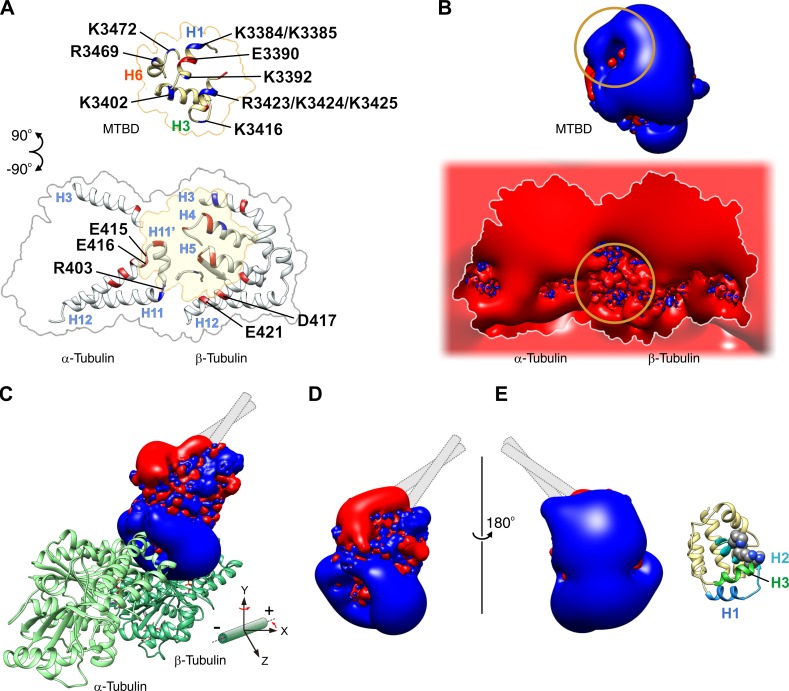
Figure 5.
Charged residues involved in the electrostatic interaction between the MTBD and MT together with the surface potential of the interfaces. (A) Distribution of charged residues on the surface of the MTBD (top) and tubulin (bottom), possibly involved in salt bridge formation across the interfaces of the MTBD and MT in the strong binding state (Fig. 4, D and E). Because the resolution of the cryoEM map is limited and does not allow visualization of side chains, we searched for pairs of charged residues located within 10 Å of each other to identify candidate residues. Positively and negatively charged residues are colored blue and red, respectively. The residues whose mutation impaired the dynein–MT interactions are labeled (Koonce and Tikhonenko, 2000). (B) 3D isopotential contours for the MTBD (top) and tubulin (bottom) calculated for the interfaces shown in A. The values of the contours are −2.5 kT/e (red) and 2.5 kT/e (blue) for the MTBD and −26 kT/e (red) and 26 kT/e (blue) for tubulin, respectively, where k is the Boltzmann constant, T is the temperature, and e is the magnitude of the electron charge. The circles indicate the areas where the direction of the electrostatic field is inverted. (C) Isopotential contours for the MTBD bound on the MT. The MTBD–MT complex shown in Fig. 4 D is rotated by 40° around the y axis and viewed from the direction of the z axis. Also see Video 3. (D) Isopotential contours for the x-ray crystal structure of the MTBD (PDB ID: 3VKH), presumably representing the weak binding state (Carter et al., 2008; Kon et al., 2012), are viewed in the same orientation as in C. (E) The model in D is turned 180° around the y axis, with the corresponding structural model shown alongside it. In the weak binding state, the MTBD may exhibit diffusion along the MT with its electropositive surface containing H2 and H3 facing toward the MT. Mutagenesis analysis showed that residue substitution in this area of the MTBD (K3402, K3415, and K3416, represented by the spheres in the structural model) resulted in decreased affinity of dynein for the MT (Koonce and Tikhonenko, 2000).

