Figure 6.
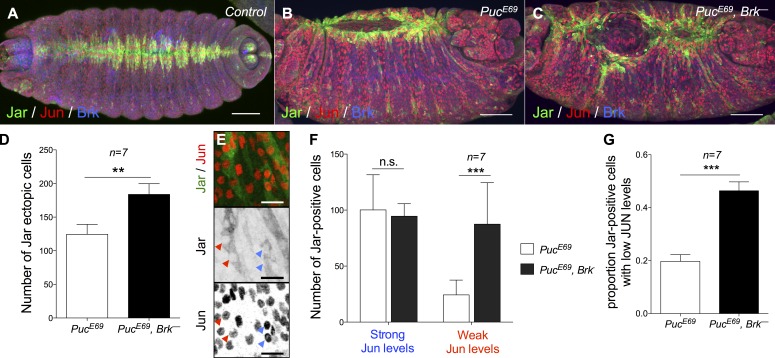
The JNK/DPP FFL filters weak ectopic JNK activity. (A–C) Control (A), PucE69 (B), and PucE69, brkM68 (C) stage 15 embryos stained for Jar, Jun, and Brk. Bars, 50 µm. (D) Quantification of Jar ectopic cells in the lateral epidermis. (n = 7; Mann–Whitney’s U test: **, P < 0.01.) Error bars: ±SEM. (E) Close-up of the lateral epidermis of a PucE69 embryo showing weak (red arrowheads) or strong (blue arrowheads) Jun expression. Bars, 10 µm. (F and G) Quantification of Jar expression in cells expressing low or high Jun levels in PucE69 versus PucE69, brkM68 embryos. (F: two-way ANOVA and Bonferroni post-hoc test: ***, P < 0.001; G: Mann–Whitney’s U test: ***, P < 0.001.) Error bars: ±SEM. Brk represses Jar in about two thirds of the cells displaying weak Jun expression.

