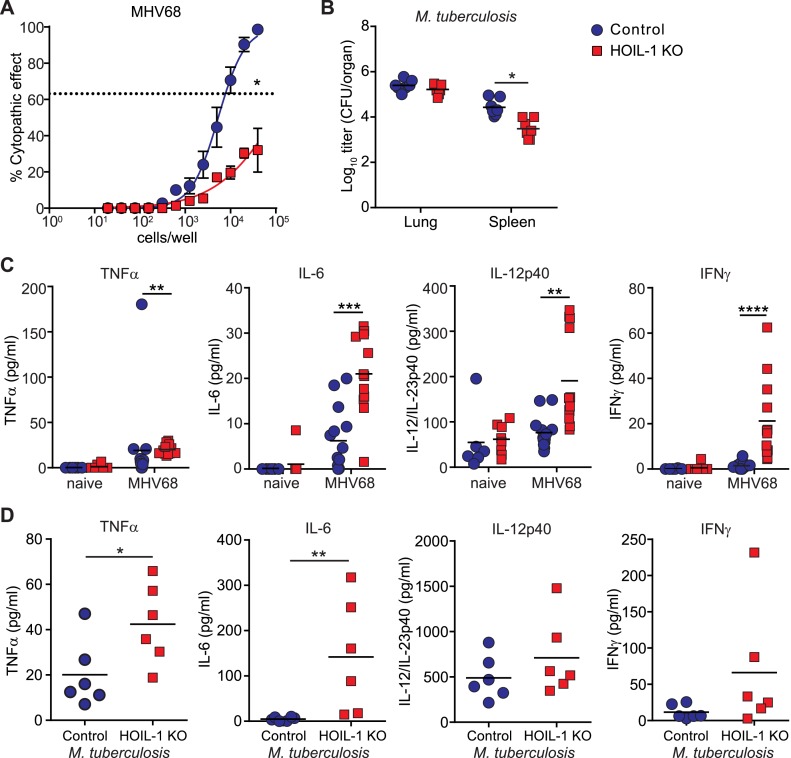
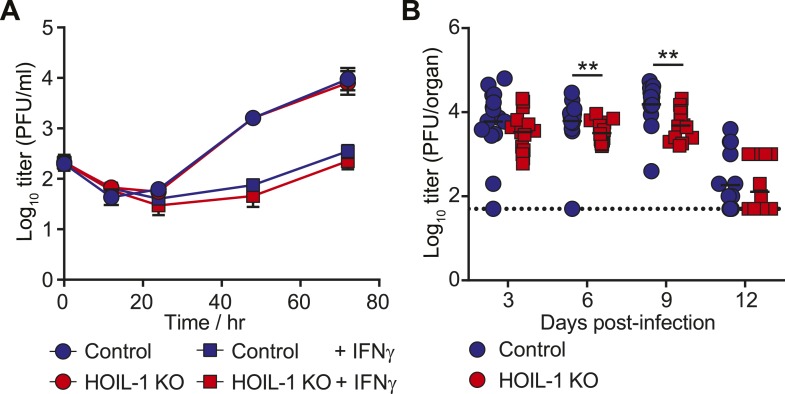
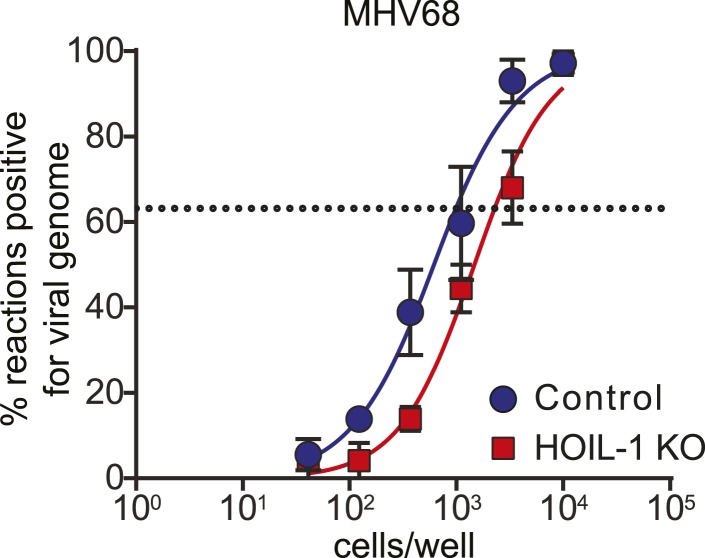
Figure 4. Enhanced inflammatory response and control of MHV68 and M. tuberculosis by HOIL-1 KO mice.
(A) Limiting dilution assay of peritoneal cells from control (blue circles) and HOIL-1 KO (red squares) mice infected with MHV68 for 28 days onto mouse embryonic fibroblast monolayers to measure the frequency of cells capable of MHV68 reactivation. The dashed line indicates 63.2%, which was used to determine the frequency of cells reactivating virus by the Poisson distribution. Data represent the mean from three independent experiments each with cells combined from three mice/group. *p ≤ 0.05. Statistical analyses were performed by calculating the number of control and HOIL-1 KO cells required for 63.2% of wells to contain complete cytopathic effect for each individual experiment by non-linear regression, then comparing these values by paired t-test. Preformed virus was not detected in disrupted samples (not shown). (B) M. tuberculosis titers in the lung and spleen of HOIL-1 KO (red squares) and control (blue circles) mice 70 days post-infection. *p ≤ 0.05. Statistical analyses were performed using t-test. (C) TNFα, IL-6, IL-12/IL-23p40 and IFNγ protein detected in serum from naïve or latently-infected (28 days) control (blue circles) and HOIL-1 KO (red squares) mice. Each symbol represents an individual mouse and the mean is indicated. *p ≤ 0.05, t-test with Welch's correction (IL-12/IL-23p40) or Mann Whitney test (TNFα, IL-6, IFNγ). (D) TNFα, IL-6, IL-12/IL-23p40 and IFNγ protein in serum from mice from (B). Each symbol represents an individual mouse. Data are combined from two independent experiments. *p ≤ 0.05, **p ≤ 0.01. Statistical analyses were performed using t-test (TNFα, IL-12p40) with Welch's correction (IFNγ) or Mann Whitney test (IL-6).


