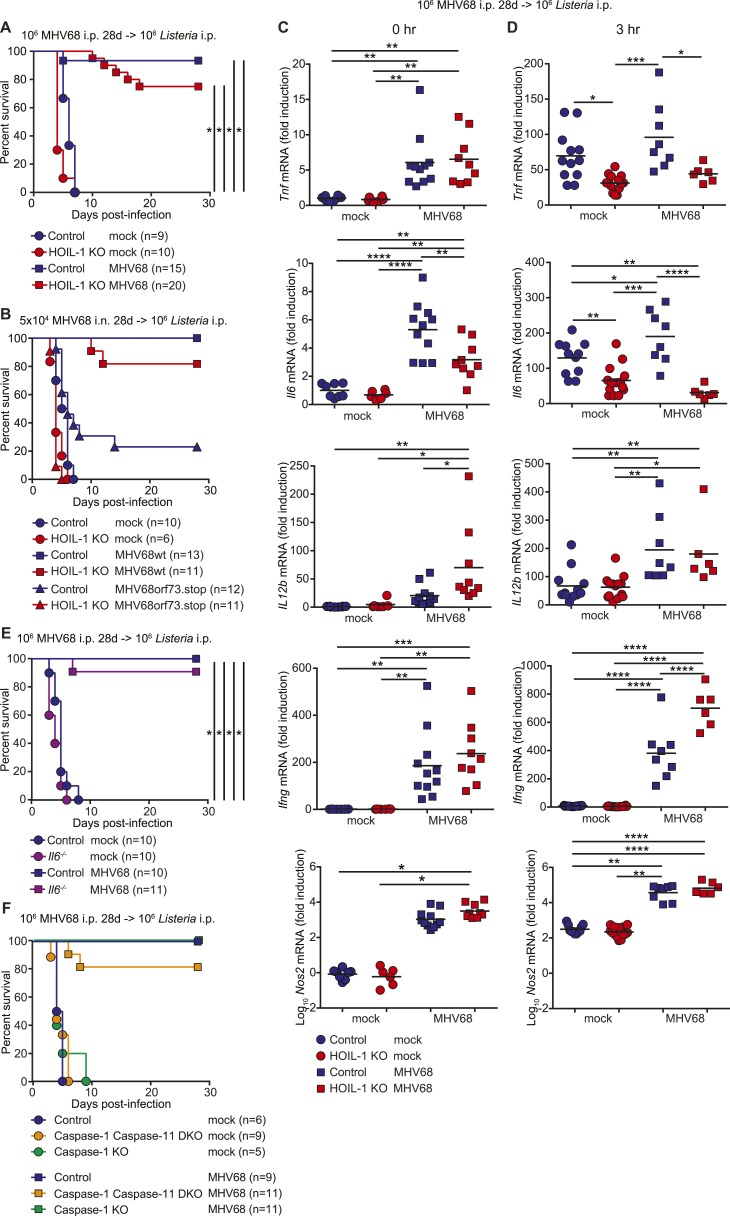
Figure 5. MHV68 latency rescues HOIL-1 KO, IL-6, Caspase-1 and Caspase-1;Caspase-11-deficient mice from Listeria-induced lethality.
(A) Survival of control (blue symbols; mock n = 9, MHV68 n = 15) and HOIL-1 KO (red symbols; mock n = 10, MHV68 n = 20) mice challenged with 106 CFU Listeria 28 days following mock infection (circles) or infection with 106 PFU MHV68 (squares). *p ≤ 0.0083; logrank Mantel–Cox test corrected for multiple comparisons. (B) Survival of control (blue symbols) and HOIL-1 KO (red symbols) mice challenged with 106 CFU Listeria 28 days following intranasal mock infection (circles) or infection with 5 × 10⁴ PFU wild-type (squares) or ORF73.stop (triangles) MHV68. Significantly different groups were: control mock infected and control MHV68wt infected, control mock infected and HOIL-1 KO MHV68wt infected, control mock infected and HOIL-1 KO MHV68orf73.stop infected, HOIL-1 KO mock infected and control MHV68wt infected, HOIL-1 KO mock infected and HOIL-1 KO MHV68wt infected, control MHV68wt infected and control MHV68orf73.stop infected, control MHV68wt infected and HOIL-1 KO MHV68orf73.stop infected, HOIL-1 KO MHV68wt infected and control MHV68orf73.stop infected, HOIL-1 KO MHV68wt infected and HOIL-1 KO MHV68orf73.stop infected, control MHV68orf73.stop infected and HOIL-1 KO MHV68orf73.stop infected. *p ≤ 0.0033; logrank Mantel–Cox test corrected for multiple comparisons. (C) Cytokine transcript levels in peritoneal cells from mock (circles) and MHV68-infected (squares) control (blue symbols) and HOIL-1 KO (red symbols) mice (28 days post-infection). (D) Induction of cytokine transcripts in peritoneal cells from mock (circles) and MHV68-infected (squares) control (blue symbols) and HOIL-1 KO (red symbols) mice (28 days) 3 hr after infection with 105 Listeria. Each symbol represents an individual mouse. For (C) and (D), *p ≤ 0.05, **p ≤ 0.01, ***p ≤ 0.001, ****p ≤ 0.0001. Statistical analyses were performed using one-way ANOVA. (E) Survival of control (blue symbols) and Il6−/− (purple symbols) mice challenged with 106 CFU Listeria 28 days following mock infection (circles) or infection with 106 PFU MHV68 (squares). *p ≤ 0.0083; logrank Mantel–Cox test corrected for multiple comparisons. (F) Survival of control (blue symbols), Caspase-1;Caspase-11 (orange symbols) and Caspase-1 (green symbols) –deficient mice challenged with 106 CFU Listeria 28 days following mock infection (circles) or infection with 106 PFU MHV68 (squares). *p ≤ 0.0033; logrank Mantel–Cox test corrected for multiple comparisons.
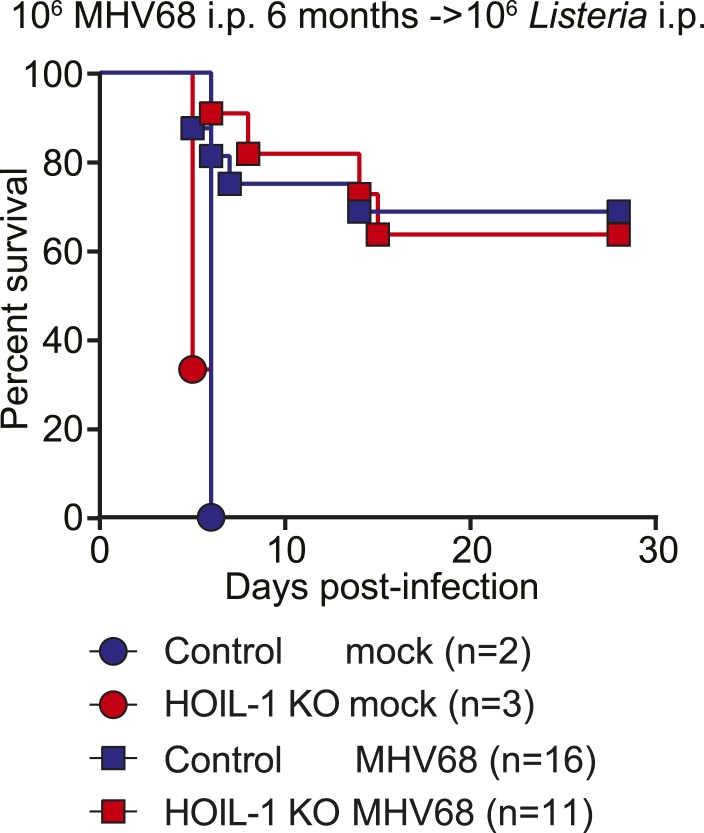
Figure 5—figure supplement 1. MHV68 latency-induced cross-protection is maintained for at least 6 months.
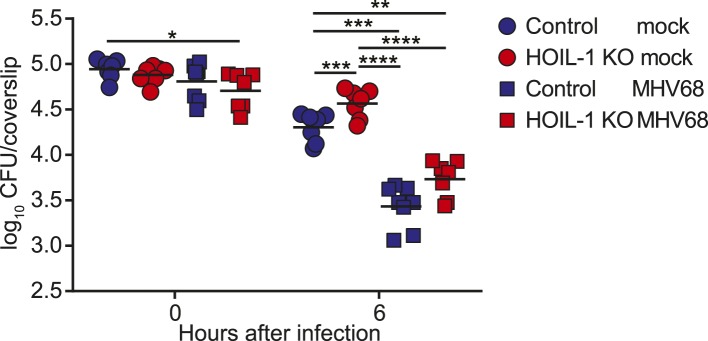
Figure 5—figure supplement 2. MHV68 latency enhances the listericidal activity of peritoneal macrophages.


