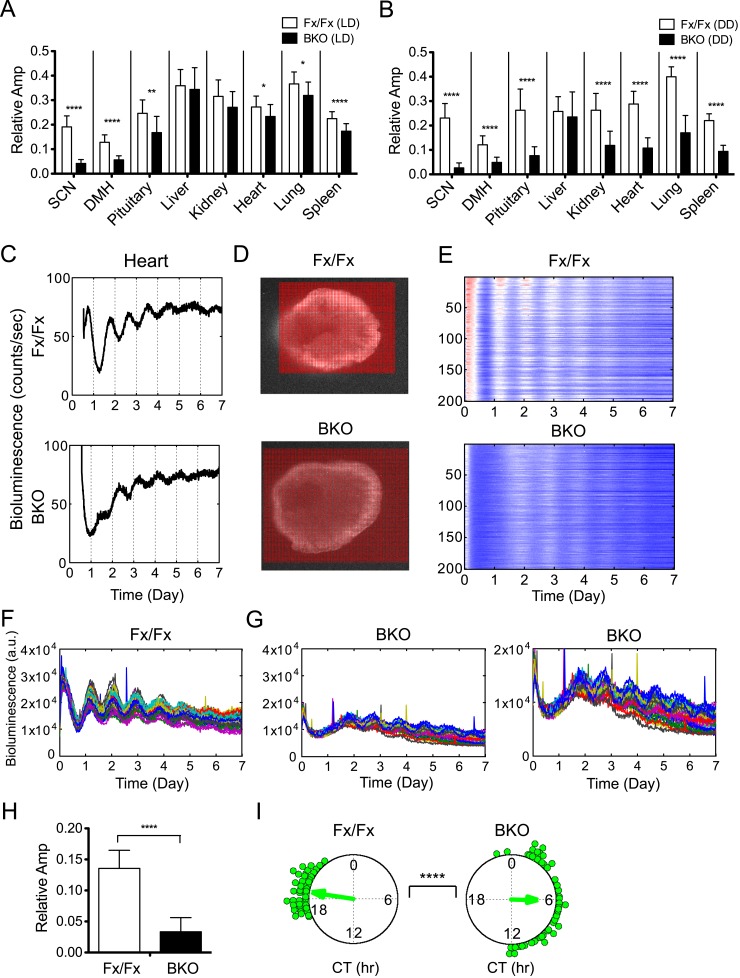
Figure 6. Decreased amplitude in peripheral tissues of BKOs.
(A, B) Normalized amplitude of bioluminescence rhythms from Fx/Fx control (open bar) vs BKO (dark bar) in LD (A) and DD (B). Mean relative amplitude ±SD are shown. The sample size is the same as in Figure 4B,C. *p < 0.05, **p < 0.01, ****p < 0.0001 by t-test. (C) Representative records of real-time monitoring of circadian expression of heart tissues in Fx/Fx control (upper) and BKO (lower) mice maintained in DD. (D) Representative frames of bioluminescence imaging with grids over each heart tissue. (E) Heat maps of the brightest 200 time-series data beginning with the strongest signals in the grids shown in (D). (F, G) Linear traces of the top 50 of time-series data from the Fx/Fx (F) and BKO (G) heart tissue shown in (E). The Y-axis was expanded for the BKO sample in the most right graph. (H) Normalized amplitude quantified from the top 50 of time-series data shown in (F) and (G). ****p < 0.0001 by t-test. (I) Circular plots of peak phase values of the top 50 time-series data shown in (F) for Fx/Fx and (G) for BKO tissues. Degree of variance was compared between the two samples by bootstrapping simulation (****p < 0.0001).


