Figure 2.

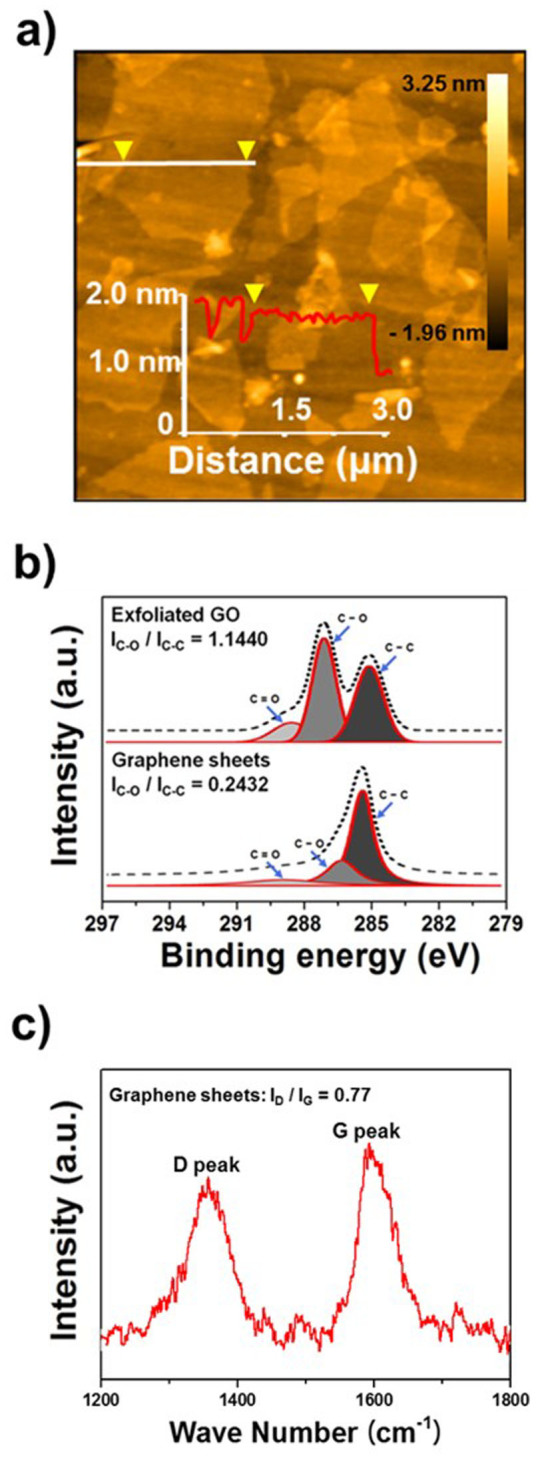
(a) AFM image of the exfoliated GO solution. (b) XPS spectrum with fitted lines of the pristine and rGO solution for C–C, C–O and C = O bonds. (c) Raman spectra of the rGO electrodes.

(a) AFM image of the exfoliated GO solution. (b) XPS spectrum with fitted lines of the pristine and rGO solution for C–C, C–O and C = O bonds. (c) Raman spectra of the rGO electrodes.