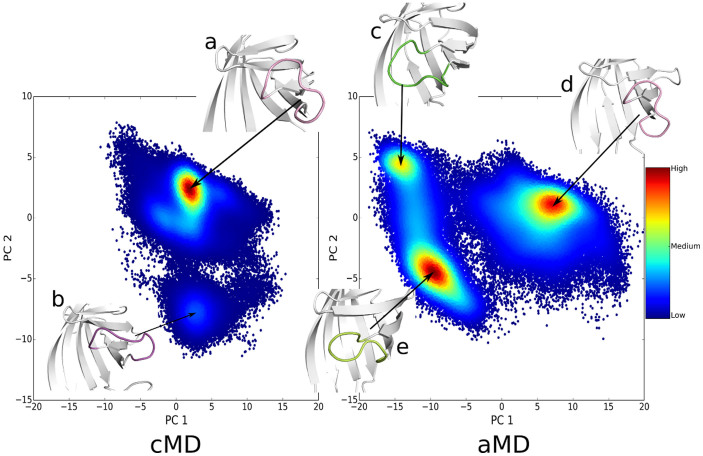
Figure 2. Projection of the loop3-4 conformational space simulated by cMD (left panel) and aMD (right panel) onto the two principal components (PC1 and PC2) produced from the PCA analysis of cMD and aMD trajectories.
The distributions of components are depicted with density-colored points, redder points denote higher density, while bluer points denote lower density. Matplotlib59 is used to generate these density-colored points. Structure a in the left panel indicated the open-loop conformation in cMD simulation, and structure b for an intermediate state. Structure c in the right panel represents the closed-loop conformation in aMD simulation, structure d for the loop-open state and structure e for an intermediate state sampled by aMD simulation.

