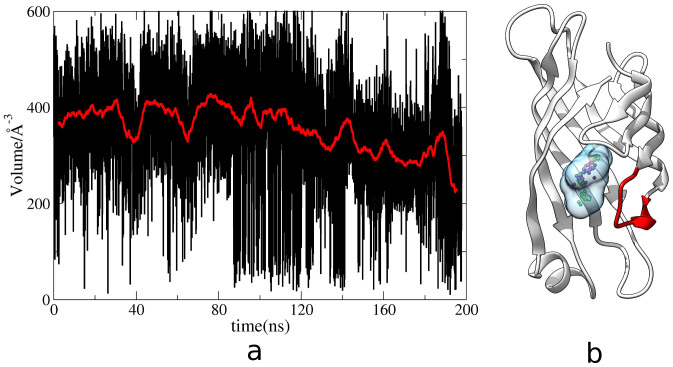
Figure 3.
a, The changes of the binding pocket volumes in aMD simulation as a function of time.Red line indicates the average changes of the volumes. b, the 170th ns simulated structure from aMD simulation. Transparent ball indicates the binding pocket, and red color shows the location of the loop3-4.

