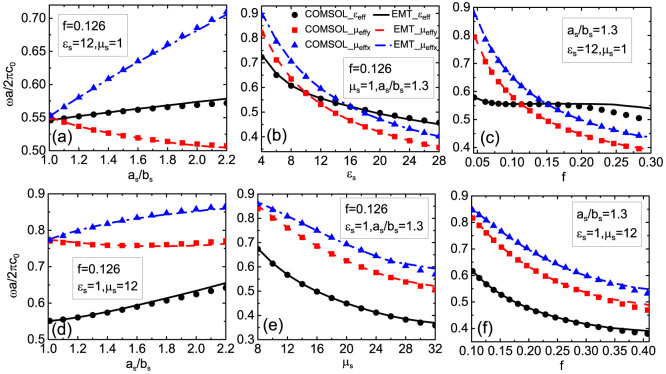
Figure 4. Effects of different parameters on derived EMT predictions.
The frequencies at which εeff, μeff,x, or μeff,y become zero according to Eq. (1), as functions of various parameters are pictured as curves. For comparison, the frequencies of the lowest monopolar and dipolar states at the Γ point, which are obtained from the band structure calculations using COMSOL, are also plotted in dots. (a) Effects of changing as/bs with fixed εs = 12, μs = 1, and f = 0.126. (b) Effects of changing εs, with fixed as/bs = 1.3, μs = 1, and f = 0.126. (c) Effects of changing f, with fixed as/bs = 1.3, εs = 12, and μs = 1. (d)−(f) Similar conditions as those shown in (a) – (c), but the dielectric cylinders (μs = 1) are replaced with magneto cylinders (εs = 1).

