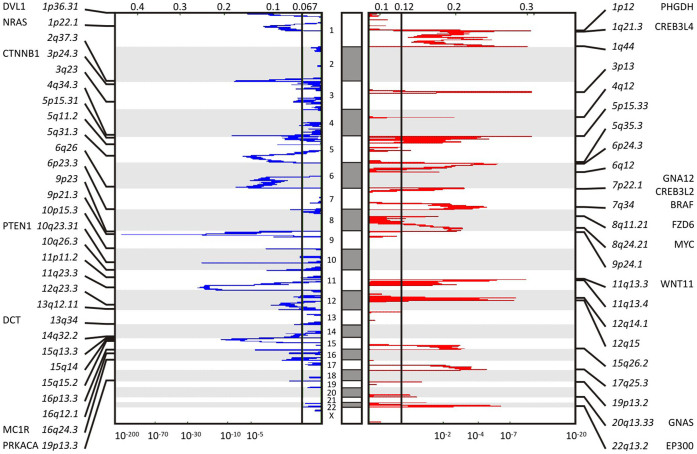
Figure 1. Somatic copy number alteration profiling of TCGA SKCM data shows significant focal deletions and amplifications.
Somatic copy number alteration analysis identifies genomic regions that are significantly gained or lost across a set of tumors. GISTIC 2.0.21 found 21 significant arm-level results, 23 significant focal amplifications, and 29 significant focal deletions in segmented SNP array data of 292 SKCM metastatic tumor samples. Among those results, amplification of BRAF, as well as reduction of NRAS and PTEN is found. The genomic position is indicated by chromosome number in the middle panel; chromosome bands and altered genes are labeled at the sides. Normalized amplifications and deletions are labeled on top and shown in red and blue, respectively.

