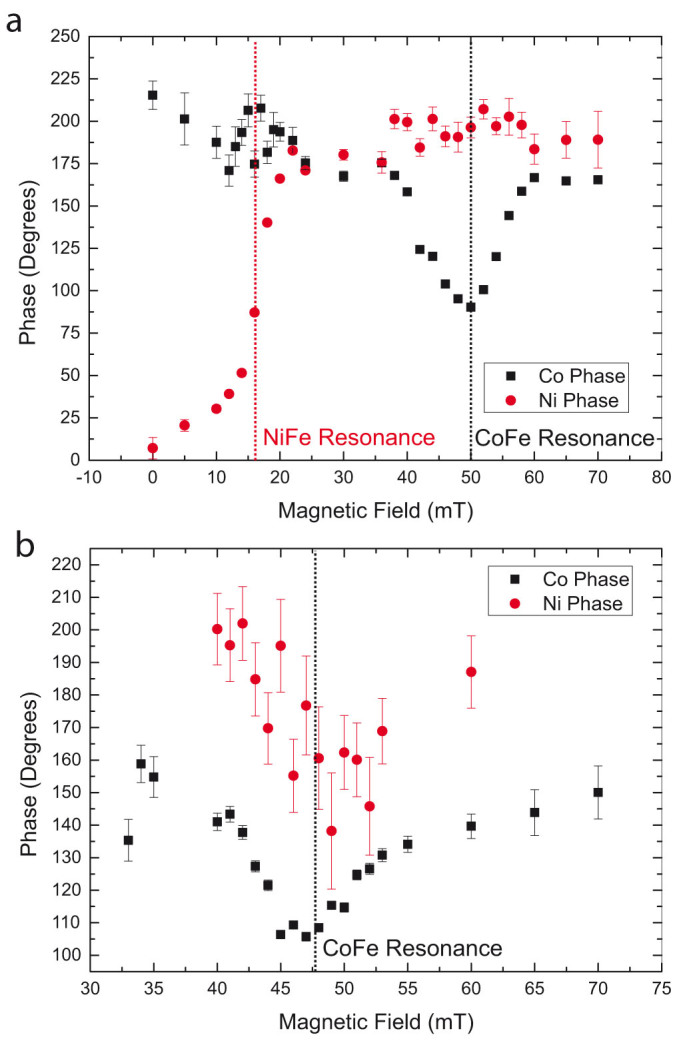
Figure 4. Phase variation across resonance.

Phase of precession of magnetisation for Ni81Fe19 (red circles) and Co50Fe50 (black squares) layers at 4 GHz driving frequency for tTI = 4 nm and 8 nm ((a),(b), respectively). Dashed lines show the positions of the resonance amplitude peak The drop and recovery in phase across the Co mode is caused by the superposition of the two modes, corresponding to canted and collinear magnetisation, as can be seen in Fig. 2b. Error bars arise from uncertainty on fits to the time-resolved precession, see Fig. 3b.
