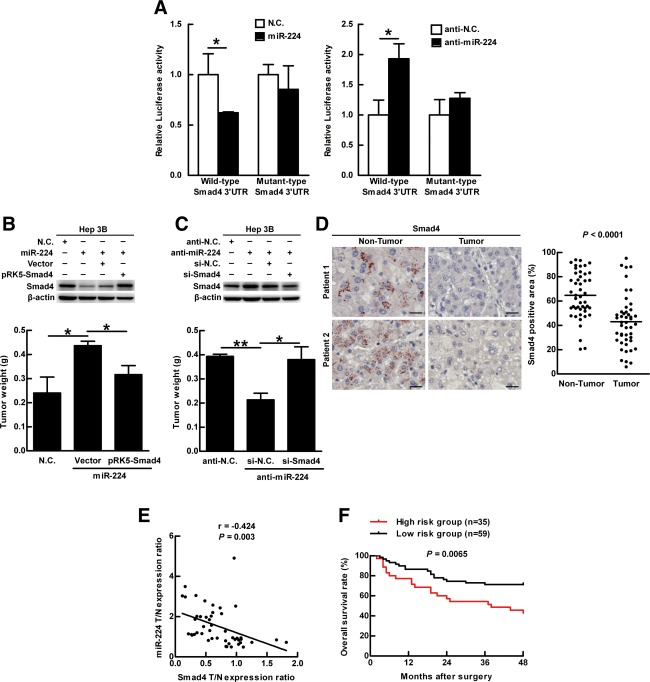
Figure 6.
MiR-224 promotes tumor formation through silencing Smad4, and together with impaired autophagy correlates with poor overall survival rate. (A) HEK293T cells were transfected with wild-type or mutant-type pMIR-Report-Smad4 plasmid and cotransfected with miR-224, miR-224 antagonist (anti-miR-224) or their negative controls (N.C. and anti-N.C.), individually. The luciferase activity was determined and normalized with Renilla luciferase activity of plasmid pRL-TK. Quantification of the data is shown as mean ± SEM (n = 5). (B) Hep 3B cells were transfected with N.C. or miR-224. The cells with miR-224 were cotransfected with pRK5-Smad4 or control vector plasmids. (C) Similarly, Hep 3B cells were transfected with anti-N.C. or anti-miR-224. The cells with anti-miR-224 were cotransfected with si-Smad4 or si-RNA negative control (si-N.C.). The protein expression of Smad4 and β-actin was determined by western blotting. The transfected cells were injected subcutaneously into NOD/SCID mice (n = 5) for 14 days and the quantification of the tumors is shown in (B,C). (D) Two representative IHC staining of Smad4 expression from 46 paired HBV-associated HCC specimens. The analysis and quantification of protein expression are the same as in Fig. 1A. Scale bar = 20 μm. P values were obtained using a paired Student t test. (E) Correlation of Smad4 expression with miR-224 was analyzed using 46 paired HBV-associated HCC specimens and linear regression coefficient and statistical significance are indicated. N, adjacent nontumor tissue; T, tumor tissue. (F) The survival rates were determined by Kaplan-Meier analysis of HCC patients 4 years after surgery. P values were obtained by log rank test. High-risk group: low-Atg5, high-miR-224, and low-Smad4 expression in the HCC tumor parts compared to the adjacent nontumor parts. The remaining specimens are defined as the low-risk group. *P < 0.05 and **P < 0.01.

