
Figure 4.
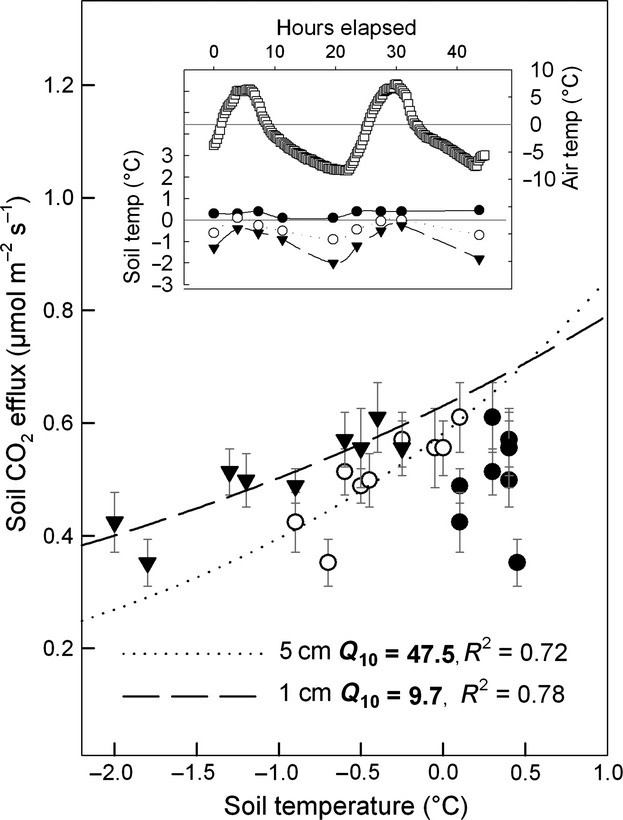
Temperature sensitivity of soil CO2 efflux during a three days measurements campaign in February 2008. Black triangles show CO2 efflux vs. soil temperature measured at 1 cm soil depth. Open and full circles show CO2 efflux vs. soil temperatures measured at 5 cm and 10cm soil depth, respectively. An exponential function (Eqn. 5) was fitted. Q10 values as a measure of temperature sensitivity are shown for 1 cm and 5 cm depth. At 10 cm soil depth, the relationship was not significant. The inner panel shows the course of air and soil temperature during CO2 efflux measurements (same symbols plus open squares for air temperature).