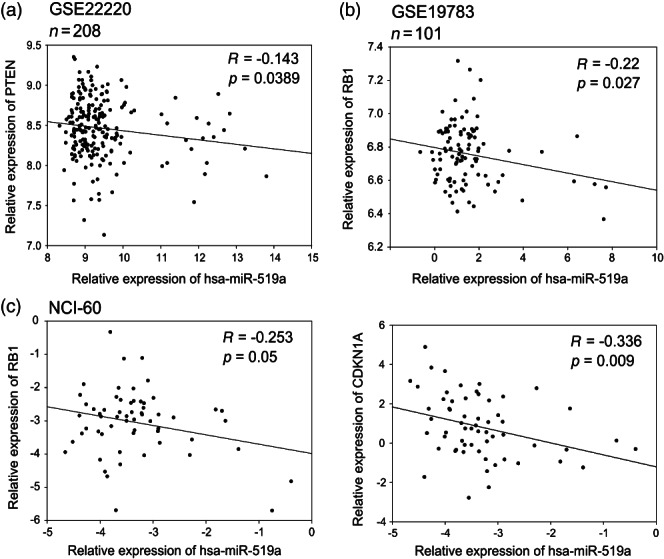
Figure 3.

Correlation analysis of miRNA-519a and its target genes in patient datasets and NCI-60 cell line panel presented as scatter plots. miRNA-519a expression is inversely correlated with expression of target genes in two patient datasets consisting of 208 patients 26 (a) and 101 patients 27 (b), as well as in the NCI-60 cell line panel (http://dtp.nci.nih.gov/index.html; experiment ID: 372685) (c).
