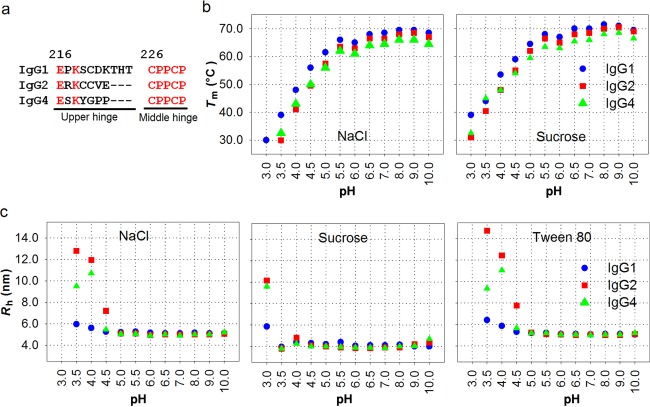
Figure 2.
(a) Primary structure of IgG1, IgG2, and IgG4 hinge regions (Kabat numbering14). (b) Tm measured by DSF and (c) Rh measured by DLS at various pH values and by inclusion of various excipients. IgG1 (blue), IgG2 (red), and IgG4 (green). DLS measurements were performed on stressed samples that were stored at 40°C for 4 days.

