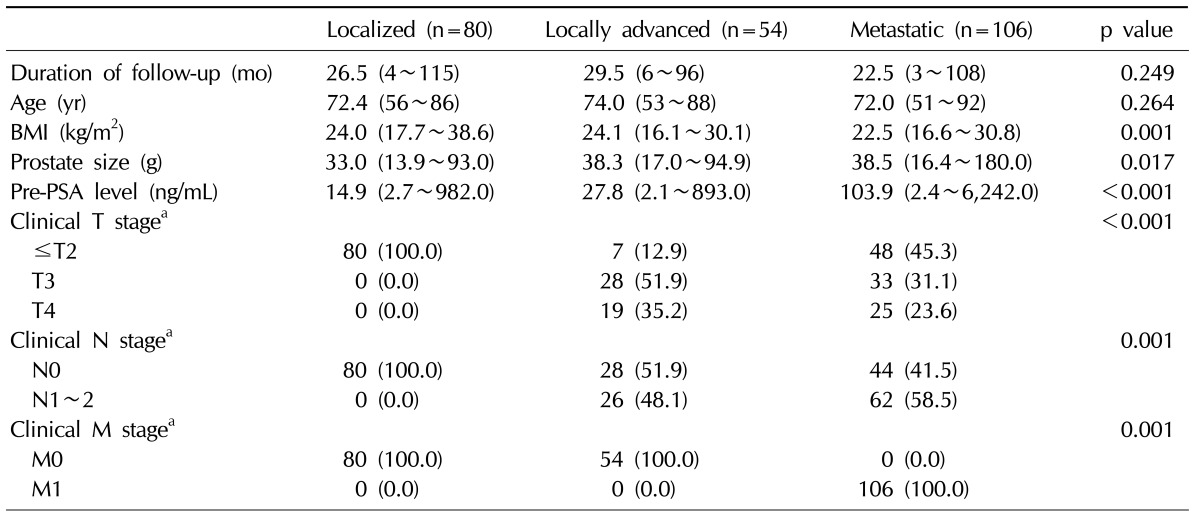
Table 2.
Comparison of the patients treated with primary androgen-deprivation therapy according to prostate cancer stage

Values are presented as median (range) or number (%).
BMI: body mass index, PSA: prostate-specific antigen.
aAll tumor stages were based on the tumor-node-metastasis (TNM) staging system.
