
Table 1.
Effect of exendin-4 on testis morphology of normal and aging mouse models (n=12)
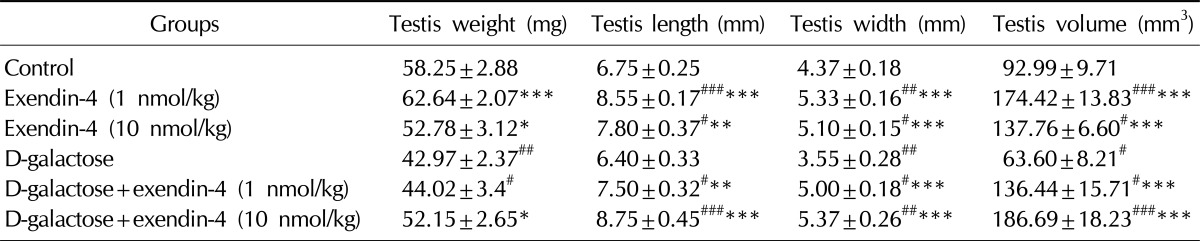
Values are presented as mean±standard error.
*p<0.05, **p<0.01, ***p<0.001 compared with the D-galactose group. #p<0.05, ##p<0.01, ###p<0.001 compared with the control group.