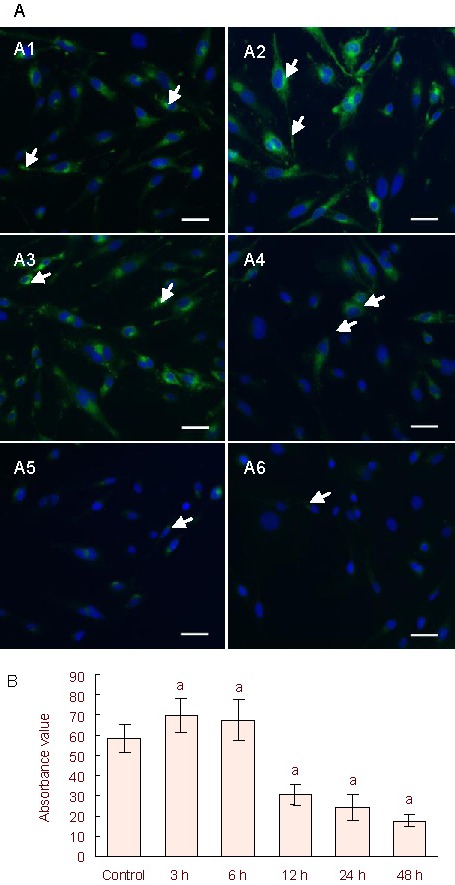
Figure 4.

Connexin 43 protein expression in C6 cells.
(A) Immunofluorescence staining detected connexin 43 protein expression in lipopolysaccharide-treated C6 cells. The nuclei were stained blue using 4’, 6-diamidino- 2-phenylindole.
(A1) Control group: connexin 43 expression (fluorescein isothiocyanate, green) was detected in the cytoplasm and protrusions (arrows). (A2–A6) 5 μg/mL lipopolysaccharide-treated groups (for 3, 6, 12, 24, and 48 hours), with arrows showing connexin 43 protein expression. Scale bars: 25 μm.
(B) Semi-quantification of immunofluorescence staining. Six non-overlapping fields were randomly selected and measured for absorbance values using ImageJ for each group.
The experiments were repeated three independent times. Independent sample t-tests and one-way analysis of variance were used to analyze the data. aP < 0.05, vs. control group.
3, 6, 12, 24, 48 h: After 3, 6, 12, 24, 48 hours of lipopolysaccharide treatment.
