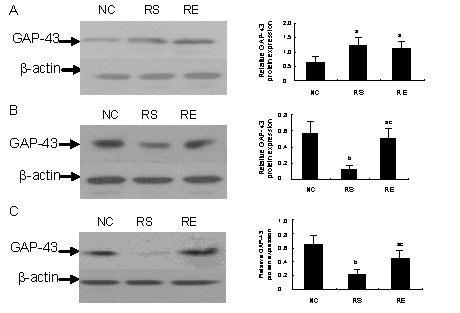
Figure 2.

Growth-associated protein 43 (GAP-43) protein levels in pup hippocampus.
(A–C) GAP-43 protein expression on postnatal day 15 (P15), P30 and P50.
Left panel shows western blots for GAP-43 (46 kDa) and β-actin (45 kDa).
Right panel exhibits the statistical results of the data in the left panel (relative expression of GAP-43 protein was normalized to β-actin).
The data are expressed as mean ± SEM from 3–4 rats from each group. aP < 0.05, bP < 0.01, vs. negative control (NC) group; cP < 0.05, vs. prenatal restraint stress (RS) group by one-way analysis of variance.
RE: Prenatal restraint stress plus enriched environment.
