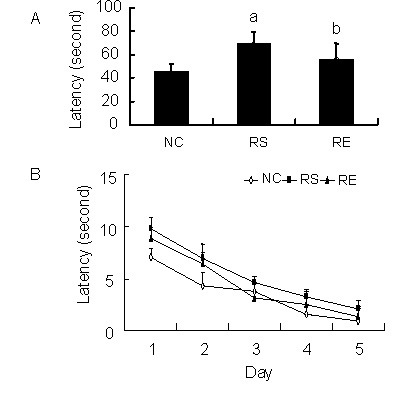
Figure 3.

Average latency in finding the platform.
Panel (A) and (B) show the average latency of pups in all groups. (A) is the average of (B). The data are expressed as mean ± SEM from 12 rats in each group.
aP < 0.01, bP < 0.05, vs. negative control (NC) group; cP < 0.05, vs. prenatal restraint stress (RS) group using repeated-measures analysis of variance with Tukey's post-hoc test. RE: Prenatal restraint stress plus enriched environment.
