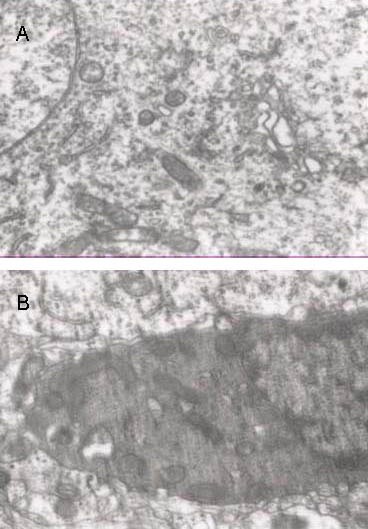
Figure 4.

Ultrastructure of infarct brain tissue in the two groups at 24 hours following cerebral infarction (transmission electron microscope, × 15 000).
In the control group (B), neuronal swelling, nuclear shrinkage, rough endoplasmic reticulum degranulation, Golgi complex expansion and vacuolization were visible. In the treatment group (A), these effects improved.
