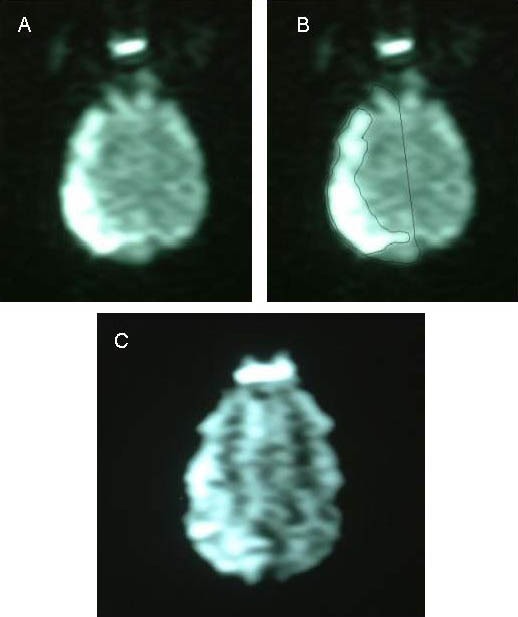
Figure 5.

Diffusion-weighted imaging at 24 hours following cerebral infarction in the two groups.
(A) Image of the treatment group; (B) Schematic map of single layer hemisphere edge and infarct edge outlined for the same level; (C) Image of the control group.
The ischemic area in the control group was larger than that of the treatment group, and the occipital lesions invaded the midline.
