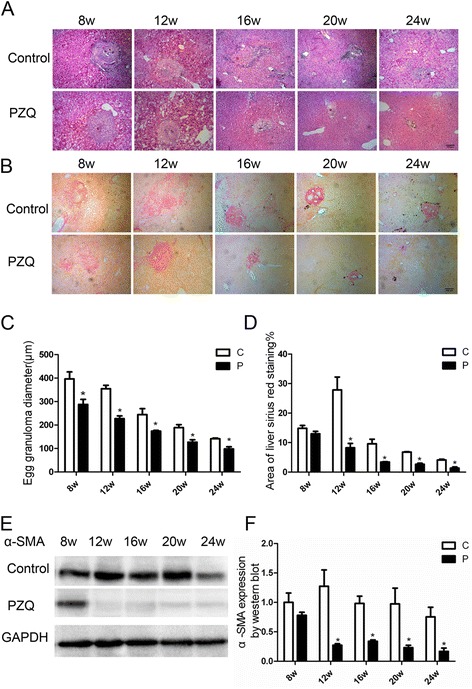
Figure 2.

Change of the diameter of egg granulomas, area of collagen deposition and expression of α-SMA. (A) Granuloma diameter. (B) Area of collagen. (C-D) Statistical analysis of images in hematoxylin-eosin staining and sirius red staining by software GraphPad, respectively. (E) Expression of α-SMA was reduced after the anti-parasite treatment of PZQ. (F) Statistical analysis of the expression of α-SMA by software GraphPad. Bar: 100 micrometer. *p < 0.05 vs the control group(without the treatment of PZQ).
