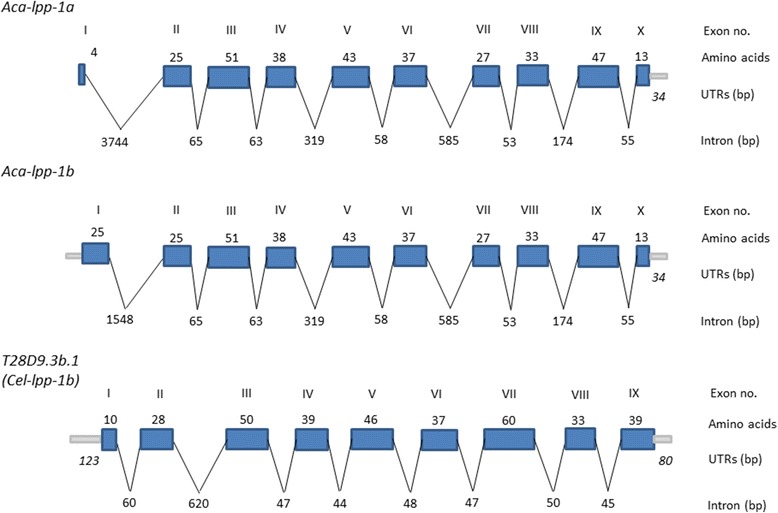
Figure 2.

Comparative gene structure of the Ancylostoma caninum and Caenorhabditis elegans lpp-1 genes. Exons are depicted as blue boxes, introns as thin lines, and untranslated regions as gray bars. The length in amino acids of the exons is depicted above the box, and the size of the introns and untranslated regions in base pairs. The two isoforms of Aca-snr-3 are shown compared to isoform b of Cel-lpp-1.
