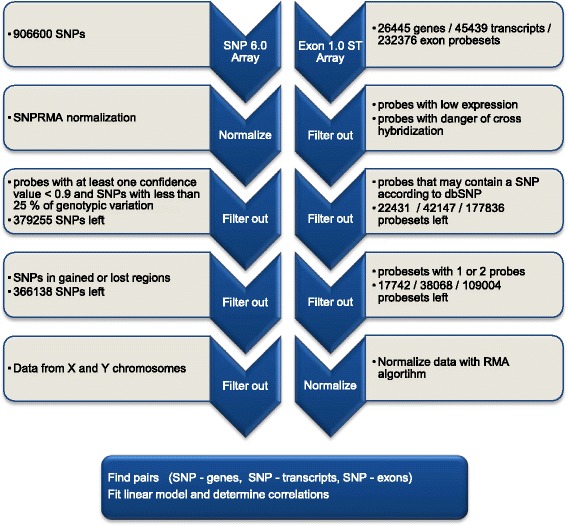
Figure 2.

The scheme of the SNP-expression analysis steps. The description of each step includes also the numbers of the remaining gene/transcript/exon probesets after the filtering. The numbers for the SNP array are for the data set with all the samples. In the analysis of a single group of cells (hESCs or hiPSCs) the number of SNPs after the second filtering step is slightly lower due to the lack of the genotypic variation.
