
Figure 3.
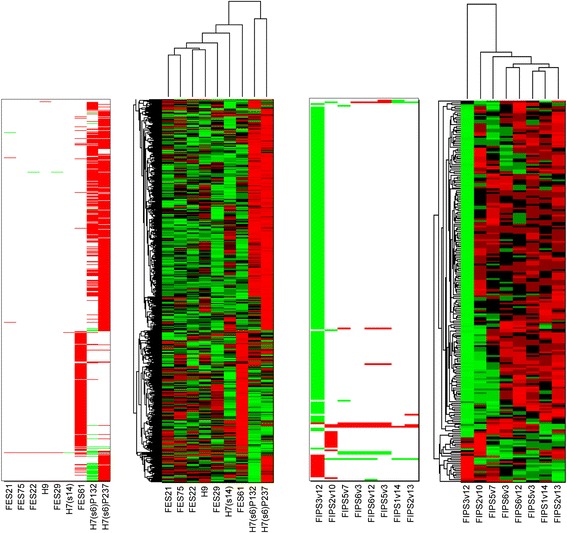
Expression and copy number values of the genes having a copy number variation in at least one of the hESC (on the left) and hiPSC samples (on the right) across all the samples in the analysis. The copy numbers are labeled with green - loss, white - no change, red -gain. The expression values are normalized row-wise, and thus the color of each gene indicates the value of the gene in respect to the other samples, red denoting high expression and green low expression value.