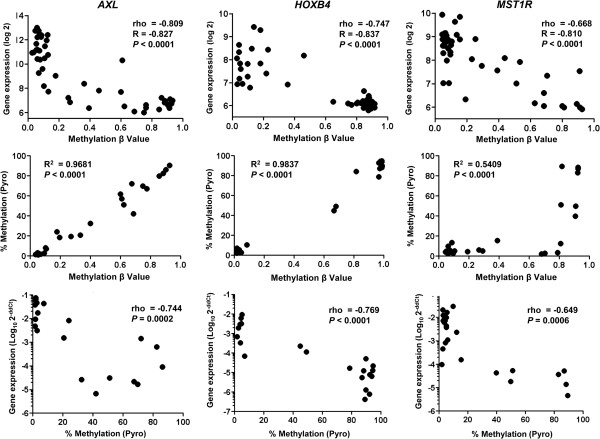
Figure 2.

Validation of the integrative analysis for select genes. Three genes with CpG islands were evaluated. Top row is the relationship between array methylation data and Illumina gene expression; middle row provides Pearson correlation of the array methylation data with the pyrosequencing methylation status; and bottom row shows the relationship of methylation status by pyrosequencing with the quantitative real-time PCR results for the expression of these genes.
