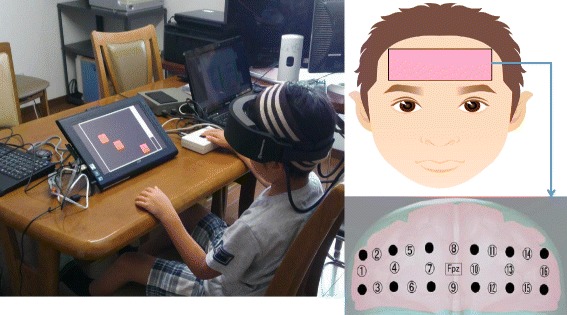
Figure 1.

This picture shows that a subject is conducting CANTAB tasks with an attached the near-infrared spectroscopy (NIRS). A schematic diagram showing the positoning of NIRS. The NIRS system was attached to the prefrontal area. The center of the probe matrix was placed on Fpz. These figures are cited from DOI:10.1016/j.braindev.2013.01.005. Neurobehavioral and hemodynamic evaluation of Stroop and reverse Stroop interference in children with attention-deficit/hyperactivity disorder.
