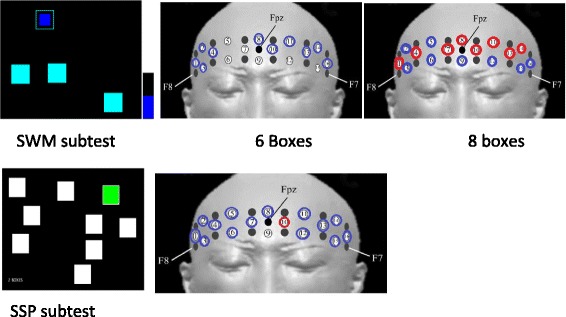
Figure 2.

Hemodynamic changes during performing tasks in MPH-off and –on (blue circle) shows MPH-off > MPH-on, (red circle) shows MPH-off < MPH-on, p < 0.05. Note; The Figures are cited from http://www.cambridgecognition.com/clinicaltrials/cantabsolutions/executive-function-tests.
