
Figure 7.
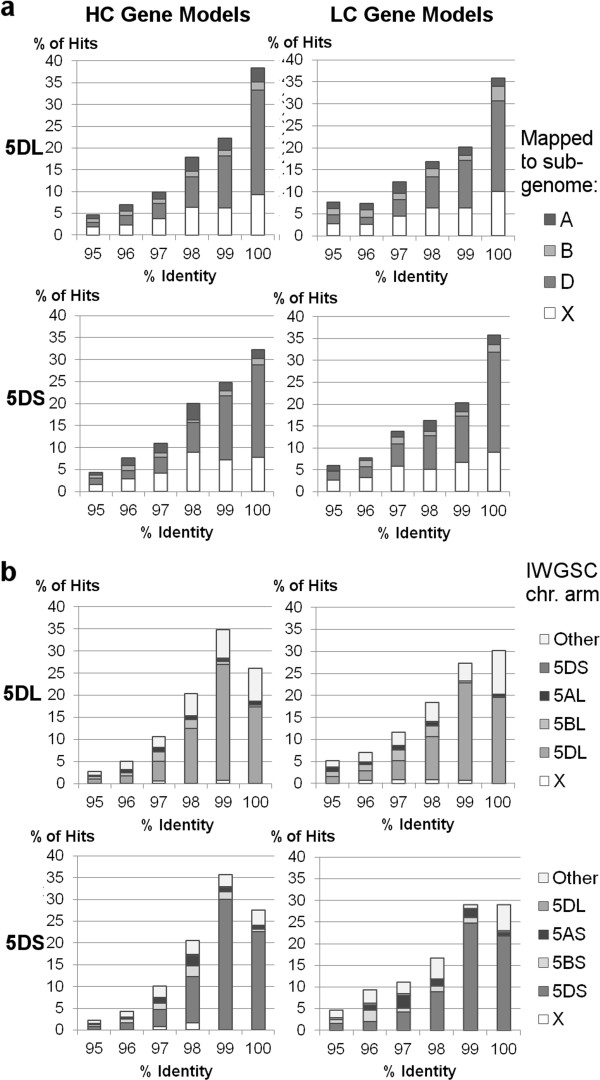
Screening of gene models against other NGS datasets. High- and low-confidence gene models from 5DS and 5DL were searched independently against gene models derived from a. whole genome shotgun 454 sequences [15] and b. chromosome-specific Illumina contigs [16]. Each bar of the histogram shows the % of all gene model hits for each comparison in a 1% sequence identity bin, starting from the value shown on the x-axis (e.g. ‘95%’ = 95.00-95.99%).