
Figure 1.
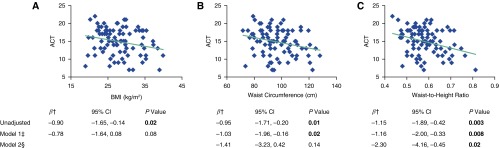
Associations between adiposity indices and Asthma Control Test (ACT) scores (range, 5–25; higher scores indicate better control). Graphs show unadjusted associations between raw values of adiposity indices and ACT scores. †Standardized as (raw value − mean)/SD and examined as a continuous variable in the regression model. ‡Model 1 controlled for age, sex, race/ethnicity, education, income, and smoking status. §Model 2 controlled for all Model 1 covariates and body mass index (BMI). CI = confidence interval. P values in bold were statistically significant (<0.05).