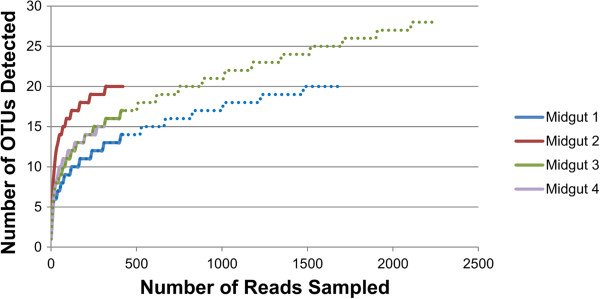
Figure 3.

Rarefaction analysis of ITS fungal amplicons sequenced from the midguts of four individual third instar larvae of A. glabripennis . Rarefaction curves appeared to reach saturation, indicating sufficient sampling to detect the majority of the fungal community diversity, although deeper sampling of samples 1 and 3 revealed the detection of 6 and 12 additional OTUs, respectively (dotted line).
