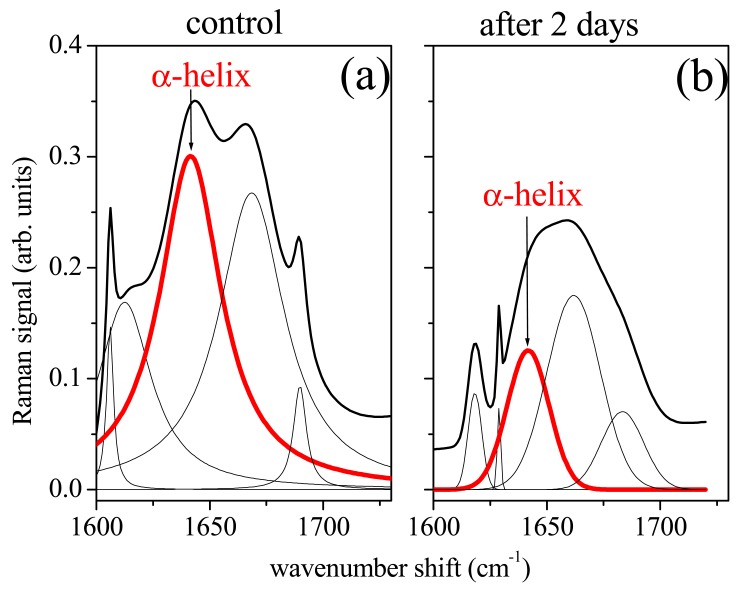
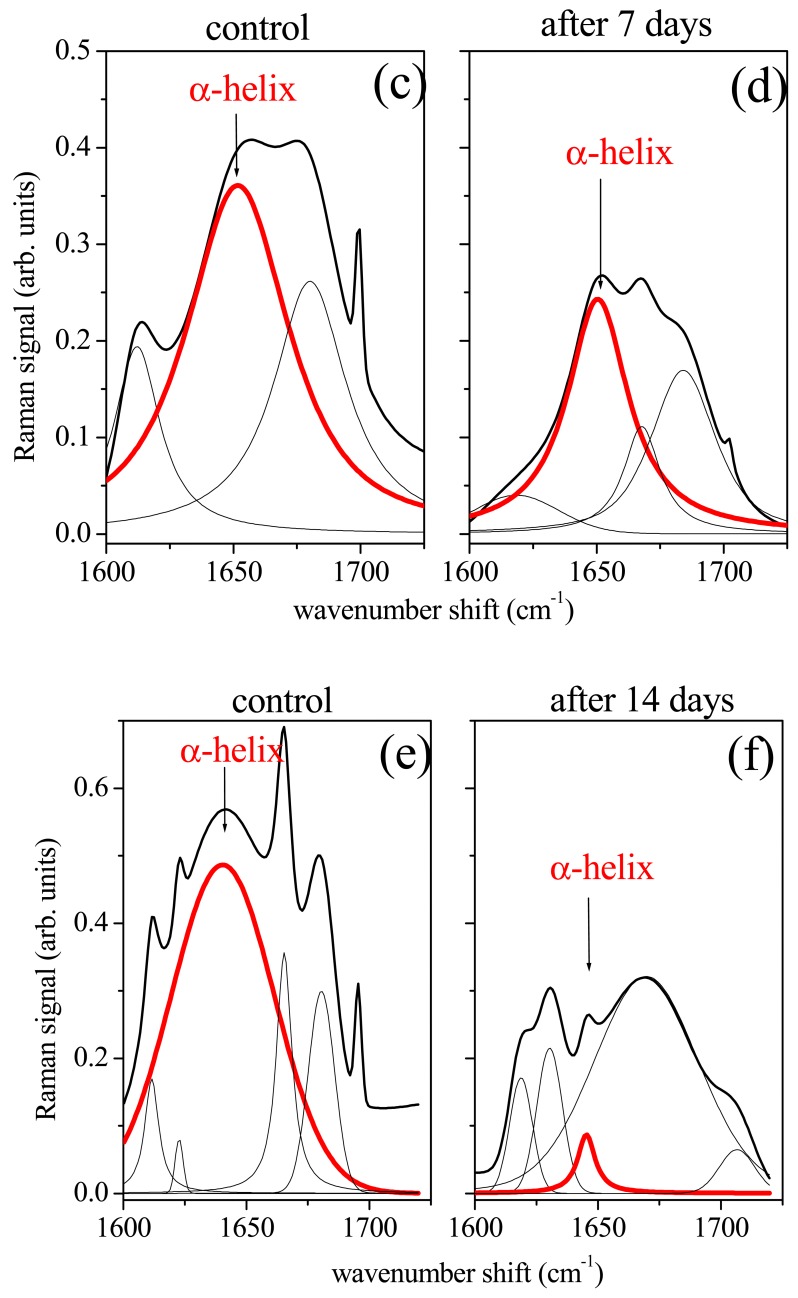
Figure 4.
Amide I region of Raman spectrum of control PDLs (a,c,e) and after orthodontic treatment of 2 days (b), 7 days (d) and 14 days (f) respectively. Experimental data have been fitted by a convolution of Lorentzian or Gaussian functions. Raman mode assigned to α-helix is underlined by the red line.


