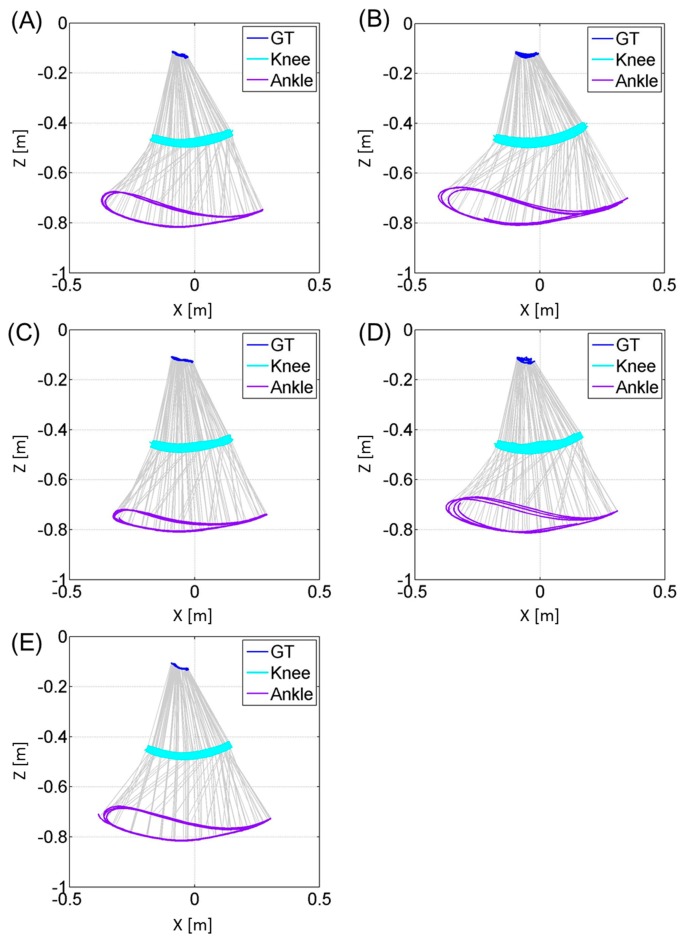
Figure 6.
These figures represent the trajectories of the greater trochanter (GT), knee joint center and ankle joint center for the right leg of each subject (A, B, C, D, E) during three gait cycle in the sagittal plane. The vertical axis represents the Zglobal axis and the horizontal axis represents the Xglobal axis. The trajectories are plotted at a sampling rate of 33 Hz.

