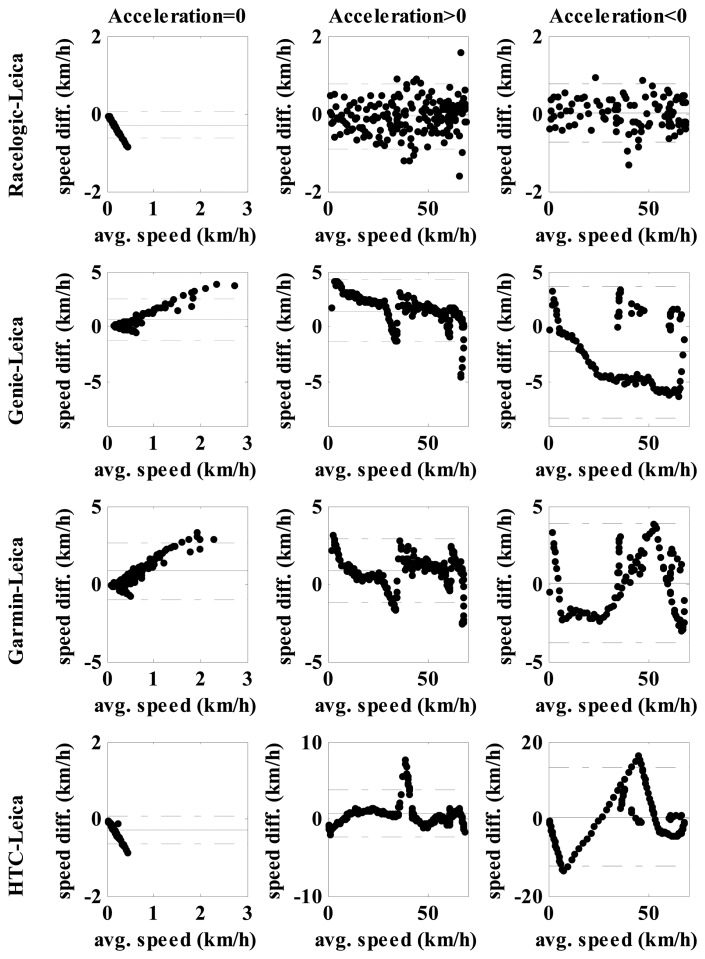
Figure 7.
Bland Altman test of agreement between the Leica and other GNSS devices. On x axis is average speed of both compared devices; on y axis is difference in speed between both devices. The first row shows data for steady speed, the second for acceleration and the third deceleration. Full horizontal line represent the mean differences and the dash-dot line 1.96 SD (standard deviation) interval in each diagram. Note that the vertical scale change sometimes in order to improve the visibility of the diagrams.

