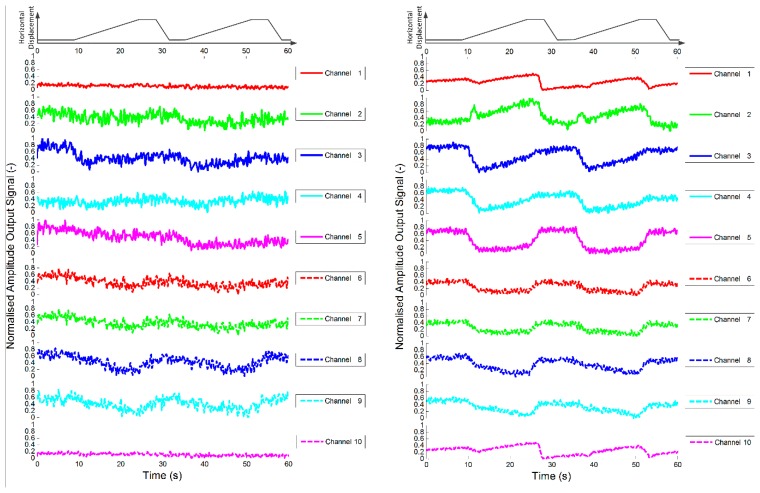
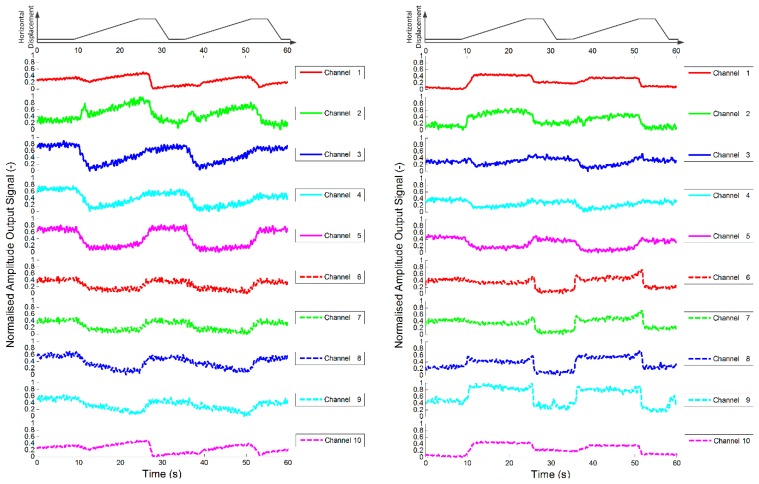
Figure 13.
Plots of dynamic variation of peak value of short time Fourier analysis of test sensor (i.e., alginate with fibroblasts) outputs during sliding test. The first rows of each plot show the horizontal displacement of the stimuli, that were a hemisphere 2.5 mm in diameter (top left), a hemisphere 5 mm in diameter (top right and bottom left), a hemisphere 10 mm in diameter (bottom right).


