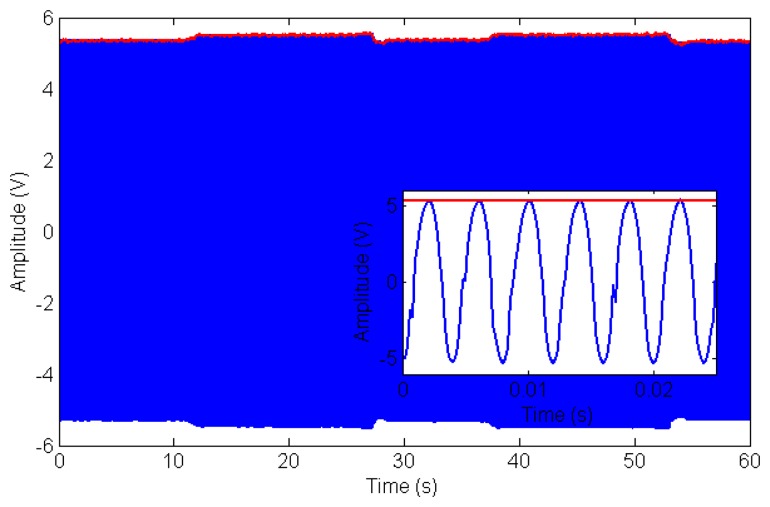
Figure 9.
Typical raw data (blue line) from a single channel during experiments involving mechanical probing of the sensor while acquiring electrical data as detailed in Section 3.2. Data was taken from channel six during the first cellular test (see Figure 11). The red line indicates the amplitude of the 250 Hz carrier wave as a function of time calculated using the short time Fourier Transform. Modulation in amplitude of the carrier (reflecting changes of current flowing through the sensor and therefore impedance modulation) can be appreciated as a mechanical load is applied in the 10 s–30 s and in the 35 s–55 s time intervals. Inset: close-up of data showing the 250 Hz carrier.

