Figure 1.

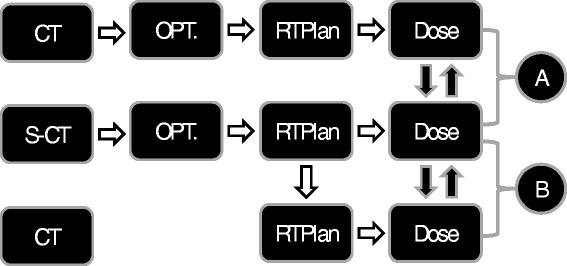
Overview of study design. Dose distributions from separate optimizations on s-CT and CT were compared in (A). Doses based on the s-CT optimization but recalculated on the CT were compared in (B).

Overview of study design. Dose distributions from separate optimizations on s-CT and CT were compared in (A). Doses based on the s-CT optimization but recalculated on the CT were compared in (B).